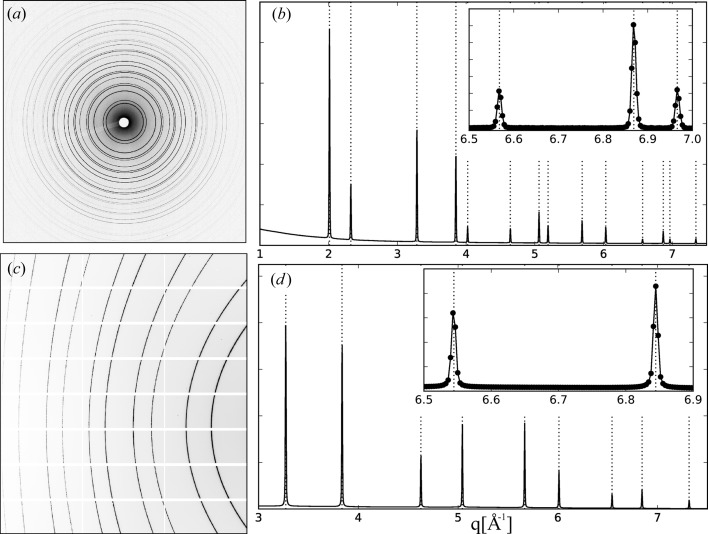
Figure 2.
(a) Powder pattern of the calibration standard CeO2 (NIST, SRM674b) recorded at beamline I11 with a Pixium area detector (RF4343, Thales Electron Devices S. A.) using an X-ray energy of 25.5 keV. (b) The one-dimensional diffractogram, intensity versus q, of the azimuthally integrated two-dimensional pattern shown in (a). Superimposed are dotted lines which indicate the q values of the calibration standard. The inset shows a zoom into the highest-q region and highlights the quality of the calibration. (c) Powder pattern of Si (NIST, SRM640c) recorded with X-rays of 12 keV at beamline I16 with a Pilatus 2M detector (Dectris Ltd) at a tilt angle of 45° degree. The white grid reflects the tiling of the detector. (d) The integrated pattern of (c) shows that all peak positions are in perfect agreement with the calculated q values of Si (dotted lines). This is emphasized by the zoom in to the high-q data shown in the inset.

