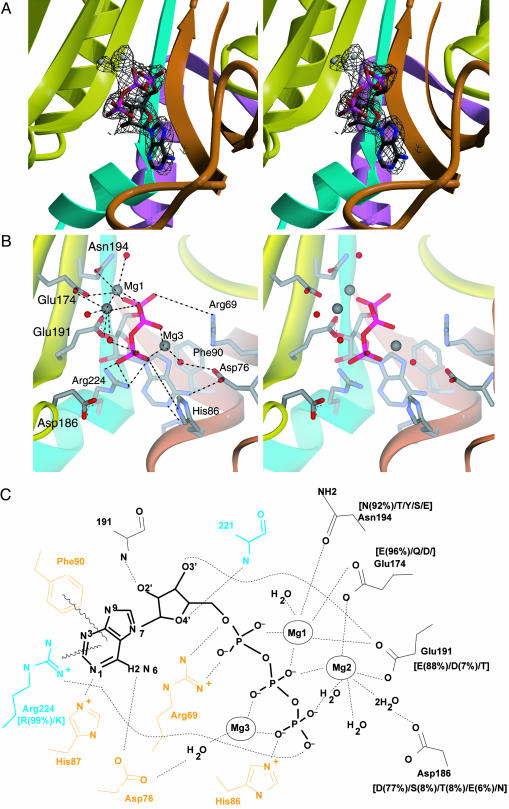
Fig. 4.
ATP binding by AlaRS. (A) Simulated annealed omit Fo – Fc electron density map (resolution, 2.15 Å; contour, 2.8 σ) for the active site region of AlaRS453/Mg2+–ATP complex, superimposed on the refined model. The model for ATP, magnesium ions, and surrounding atoms within a sphere of 3.2 Å was omitted from map calculation. (B) Similar view showing active site residues involved in ATP or magnesium binding. Model colors are as in Fig. 1. Bound magnesium ions and water molecules are shown as gray and red spheres, respectively. For clarity, some water molecules and interactions with the ribose are not shown. (C) Schematic of the interactions between enzyme, ATP, and magnesium. Residues from motifs 2 and 3 are shown in orange and cyan, respectively. Residues in black belong to strands in the central β-sheet of the active-site domain. Side chain conservation patterns among AlaRS sequences from 80 organisms are shown in brackets (percentage occurrence shown only for side chains present in >4% of the sequences). Side chains without adjacent bracketed numbers are invariant.

