
Figure 1.
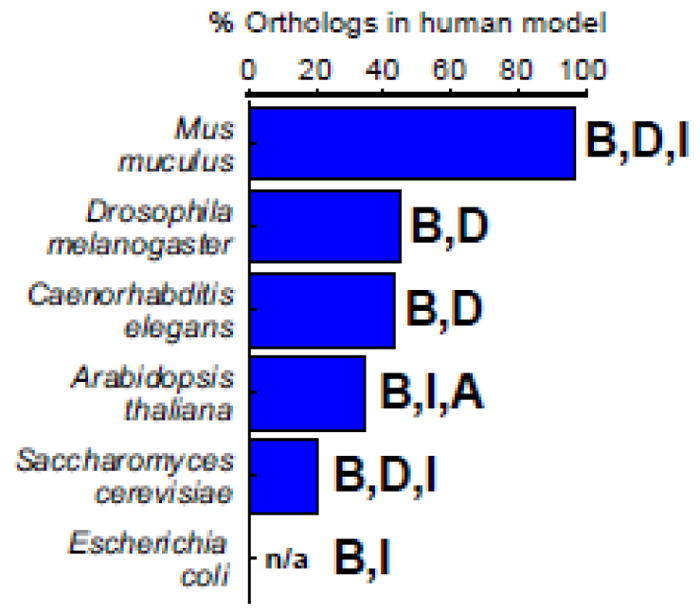
Model organisms reviewed. Percentage of genes in a human genome scale metabolic network model [4*] that have orthologs to each model organism is shown based on [31]. This number is not available for E. coli. Bold letters indicate whether the metabolic network modeling with the indicated organism is relevant to basic understanding (B), human disease (D), industrial applications (I), or agricultural (A) applications.