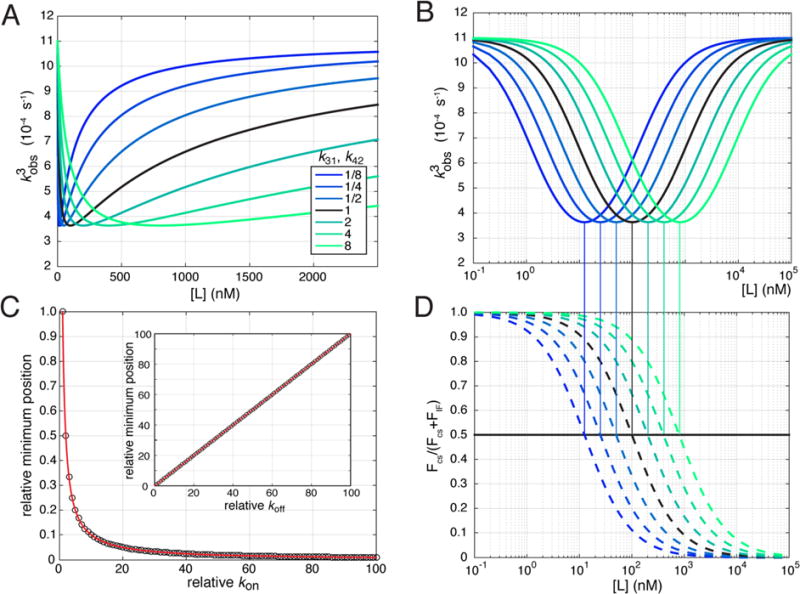
Figure 2.

Single eigenvalue that describes a nonmonotonic third observed rate. (A) Third eigenvalue or observed rate (kobs,3) as a function of ligand concentration. The family of curves contains the original rate set described in the text (black) and rate sets where both the ligand dissociation rates have been increased (green) or decreased (blue) according to the factors in the legend. (B) Same as panel A plotted on a logarithmic concentration scale. (C) Minimum position relative to the original rate set as described in the text as a function of either the relative ligand on-rates (k13 and k24)or the relative ligand off-rates (inset, k31 and k42). (D) Fractional flux [FCS/(FCS + Fif)] through the conformational selection arm of the cycle plotted as a function of ligand concentration for the rate sets plotted in panels A and B. The vertical lines connecting panels B and D indicate the coincidence of the ligand concentrations of 50% fractional flux and the position of the minima in panel B.
