
Figure 3.
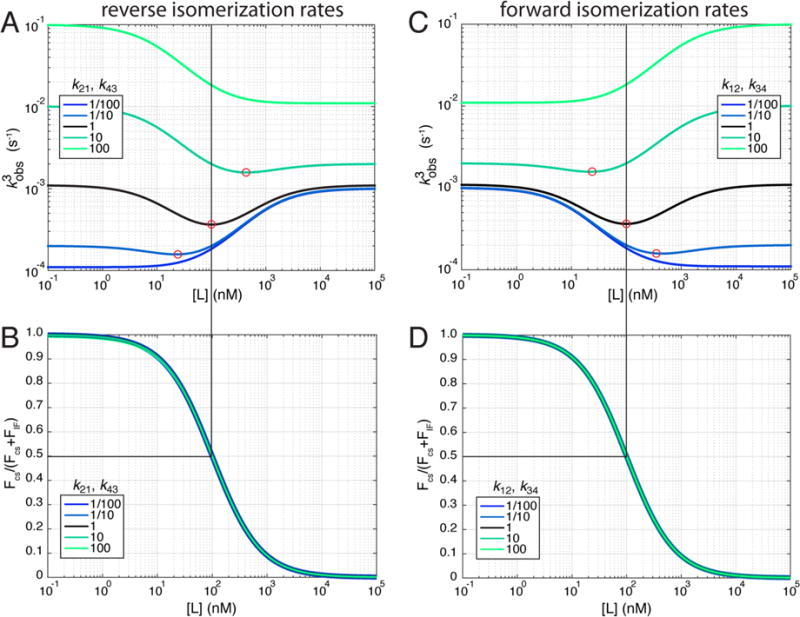
Third observed rate and fractional flux as a function of ligand concentration for different isomerization rates. (A) The reverse isomerization rates (k21 and k43) from the original rate set (black) were increased (green) or decreased (blue) by the factors indicated in the legend. Red circles indicate the approximate positions of the minimum observed rate for each curve. (B) Equilibrium fractional flux through the conformational selection pathway as a function of ligand concentration for the rate sets in panel A. (C) The forward isomerization rates (k12 and k34) from the original rate set (black) were increased (green) or decreased (blue) by the factors indicated in the legend. Red circles indicate the approximate positions of the minimum observed rate for each curve. (D) Equilibrium fractional flux through the conformational selection pathway as a function of ligand concentration for the rate sets in panel B.