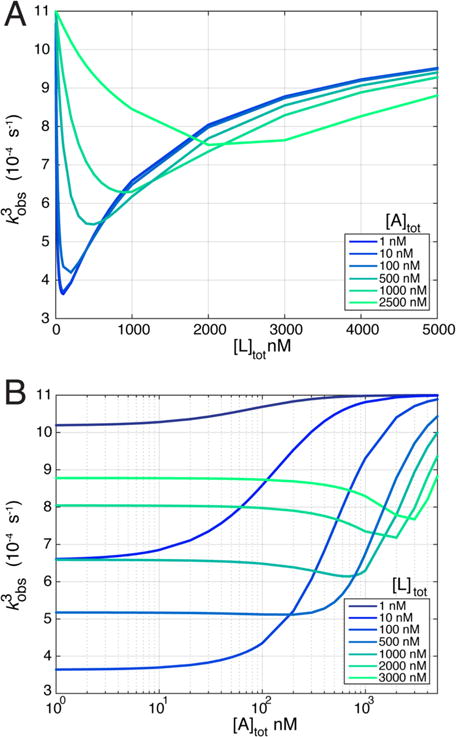
Figure 4.

Non-pseudo-first-order conditions. The free ligand concentration was tracked during simulations, and relaxation curves were fit with single exponentials to estimate an observed rate for non-pseudo-first-order conditions. (A) Observed rate as a function of total ligand concentration with different concentrations of binding partner, A (shown in the legend). (B) Observed rate as a function of total A concentration in the presence of different concentrations of total internal ligand, L (shown in the legend).
