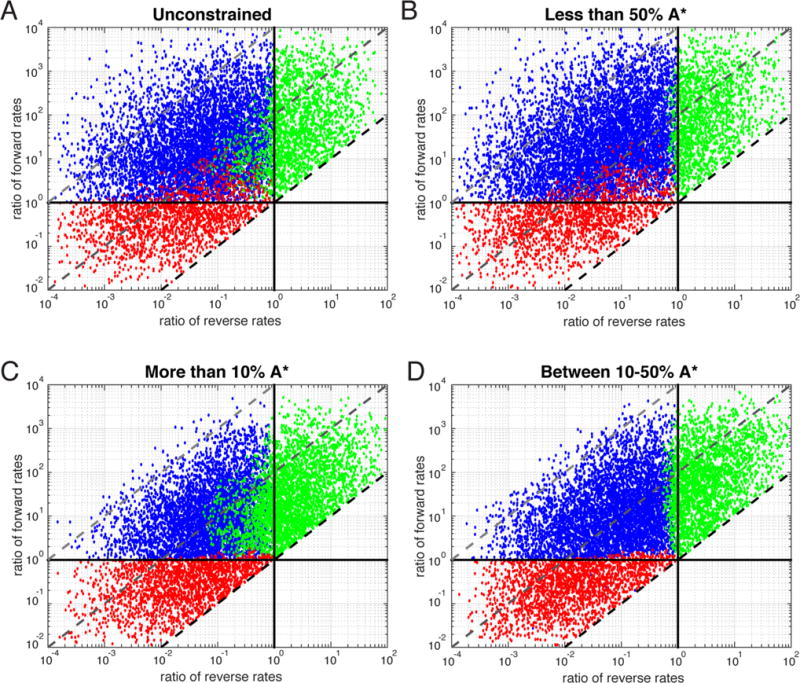
Figure 5.

Exploration of rate space. Random sets of rates satisfying detailed balance were selected. Each rate was picked from a log-random distribution centered on the original rate set and covering 3 orders of magnitude. Each rate set is represented as a single point on the graphs where the x-axis is the ratio of the reverse rates in the presence and absence of ligand (k43/k21) and the y-axis is the ratio of the forward rates in the presence and absence of ligand (k34/k12). The vertical and solid horizontal lines represent ratios of 1 for the reverse and forward rates, respectively. The dashed diagonal lines represent contours of constant ΔΔG or degrees of stabilization of A*L. The conformational equilibrium (A ↔ A*) was subject to the following constraints: (A) unconstrained, (B) <50% A*, (C) >10% A*, and (D) between 10 and 50% A*. The distribution is subdivided into rate sets that exhibit a nonmonotonic (blue), decreasing (red), and increasing (green) third observed rate.
