Figure 6.

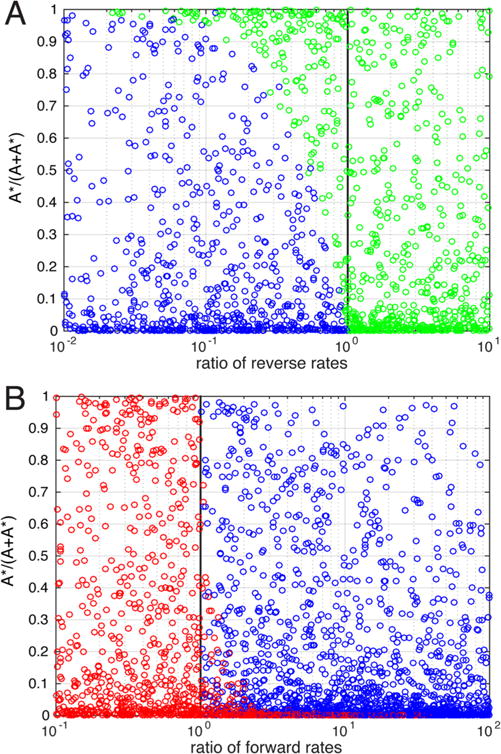
Effect of initial stability on observed rate trends. Rate sets are plotted as in Figure 5 using the fractional occupancy of A* with no ligand present and (A) the ratio of the reverse rates or (B) the ratio of the forward rates.

Effect of initial stability on observed rate trends. Rate sets are plotted as in Figure 5 using the fractional occupancy of A* with no ligand present and (A) the ratio of the reverse rates or (B) the ratio of the forward rates.