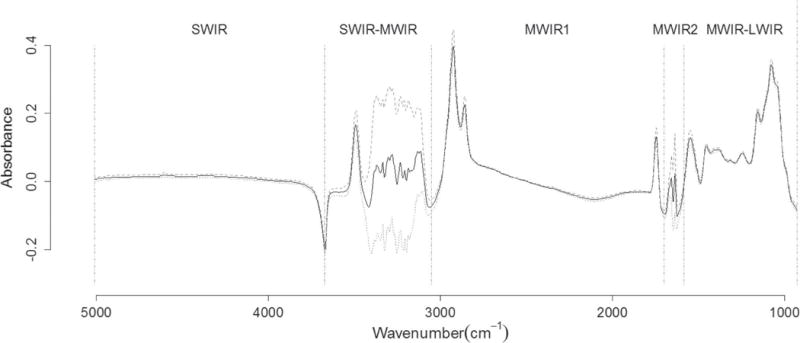
Figure 1.

Absorbances of milk samples (Log T−1; solid black line represents the average, whereas the 2 gray lines represent the mean ± SD). The vertical dashed lines define the 5 infrared regions (SWIR = short-wavelength infrared or near-infrared; MWIR = mid-wavelength infrared; LWIR = long-wavelength infrared).
