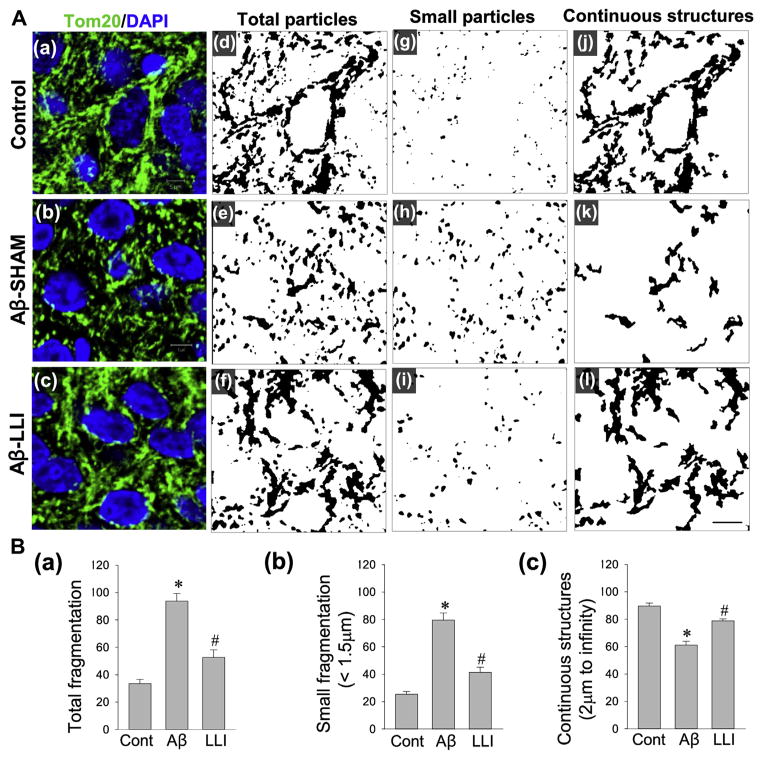
Fig. 5.
Effects of LLI on Aβ-induced changes in mitochondrial dynamics within the hippocampus CA1 neurons 6 days after Aβ infusion. (A) Representative confocal microscopy images of immunostained hippocampal CA1 pyramidal neurons with anti-Tom20 antibody (green, a–c) 6 days after Aβ infusion. Nuclei were counterstained with DAPI (blue). Acquired images of Tom20 fluorescent staining were thresholded, filtered (median, 2.0 pixels), and binarized for image views and quantitative analyses in each group. Mitochondrial segments were analyzed, using ImageJ software, for total particles (d–f), small particles (g–i, size <1.5 μm), and continuous structures (j–l, size >2 μm) to examine the effect of LLI on Aβ-induced mitochondrial fragmentation. Scale bar = 5 μm. (B) The number of total mitochondrial particles (a) and small mitochondrial particles (b) were normalized to the total mitochondrial area, respectively, to obtain the counts for total mitochondrial fragmentation and small mitochondrial fragmentation. Continuous mitochondrial structures were calculated as the percentage of the area of large particles normalized to the total mitochondrial area (c). Data are presented as means ± standard error from 5 to 7 rats in each group. *p < 0.05 versus normal control, #p < 0.05 versus LLI-untreated Aβ group. Abbreviations: Aβ, beta amyloid; LLI, low-level laser irradiation. (For interpretation of the references to color in this figure legend, the reader is referred to the Web version of this article.)

