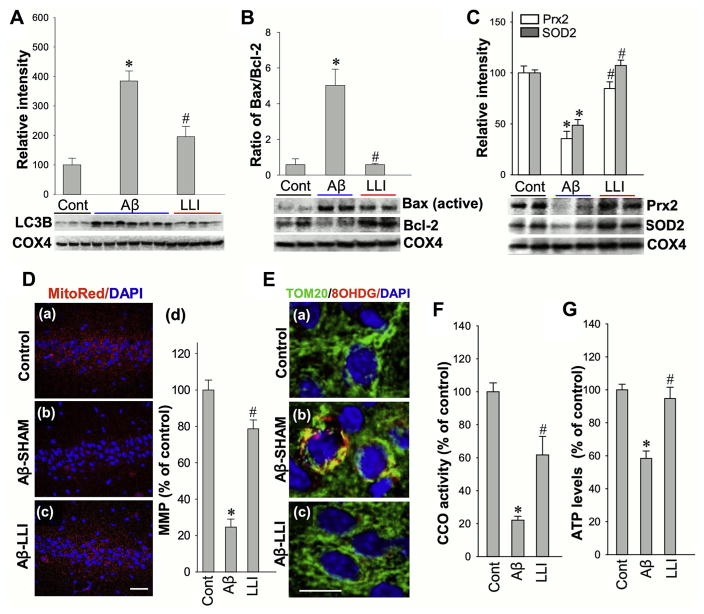
Fig. 6.
LLI attenuates mitochondrial dysfunction within the hippocampus CA1 neurons 6 days after Aβ infusion. (A–C) Western blotting and quantitative analyses of protein levels in mitochondrial fractions of hippocampal CA1 region by using the indicated antibodies. COX4 was used as loading controls for mitochondrial fractions. A ratio of Bax to Bcl-2 protein expression was further calculated. (D) Confocal microscopy analysis of MMP with fluorescent MitoTracker Red staining (a–c). The mean fluorescence (red) associated with MMP in each group was further quantified as percentage changes versus control group (d). Nuclei were counterstained with DAPI (blue). Scale bar = 50 μm. (E) Representative confocal microscopy images of immunostained hippocampal CA1 pyramidal neurons with anti-Tom20 antibody (green), anti-8OHDG (red), and DAPI (blue) 6 days after Aβ infusion (a–c). Note Aβ-induced mtDNA oxidization, merged staining (yellow) between Tom20 and 8OHDG, was reversed by LLI to a level in control group. Scale bar = 10 μm. (F and G) Cytochrome c oxidase (CCO) activity and levels of ATP production were subsequently tested using mitochondrial fractions and total protein fractions, respectively, to evaluate mitochondrial function. All the data are expressed as means ± standard error, n = 4–6 in each group. *p <0.05 versus control group, #p <0.05 versus LLI-untreated Aβ group. Abbreviations: Aβ, beta amyloid; LLI, low-level laser irradiation; MMP, mitochondrial membrane potential; mtDNA, mitochondrial DNA. (For interpretation of the references to color in this figure legend, the reader is referred to the Web version of this article.)

