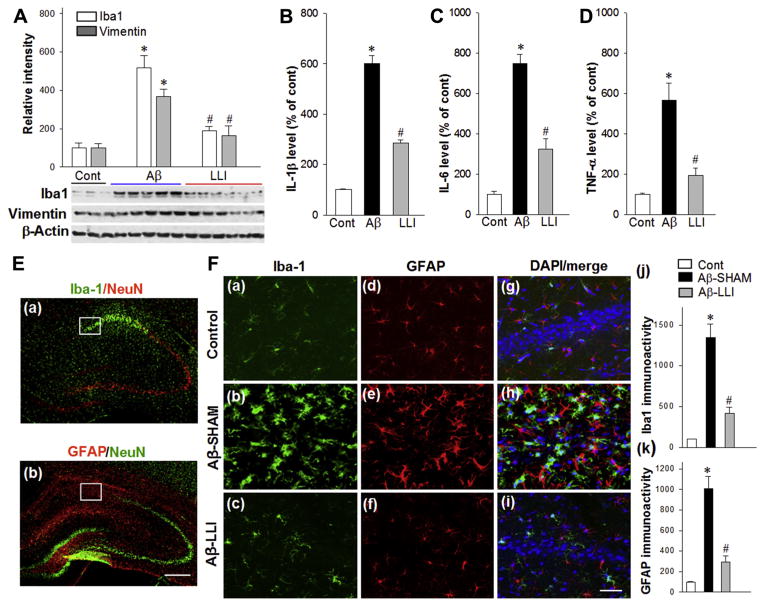
Fig. 8.
LLI inhibits Aβ-induced glial activation and proinflammatory cytokines production. (A) Western blotting and quantitative analyses of Iba1 and Vimentin, the markers for reactive microglia and reactive astrocytes, respectively, using total protein samples from hippocampal CA1 region. Note that LLI significantly suppressed Aβ-induced glial activation 6 days after Aβ injection. (B–D) ELISA assays of proinflammatory cytokines IL-1β, IL-6, and TNF-α were performed using hippocampal CA1 proteins 6 days after Aβ injection. Data are expressed as means ± standard error from 4 to 5 animals in each group and quantified as percentage changes versus normal controls. (E) Typical overview images of Iba1 (a, green) and GFAP (b, red) immunostaining showing Aβ-induced remarkable activation of microglia and astrocytes in medial hippocampal CA1 regions 18 days after Aβ injection. Brain sections were counterstained with anti-NeuN antibody. Scale bar = 500 mm. (F) Representative confocal microscopy of Iba1 (green) and GFAP (red) staining taken from medial hippocampal CA1 region at day 18 after Aβ injection (a–i). Nuclei were counterstained with DAPI (blue). Images in F are taken from the white boxed areas in the panels of E. The immunoactivity associated with Iba1 and GFAP in each group were further quantified and shown as percentage changes versus control group (j and k). The results are representative of 4–5 animals per group. Scale bar = 50 μm. *p < 0.05 versus control group, #p < 0.05 versus LLI-untreated Aβ group. Abbreviations: Aβ, beta amyloid; LLI, low-level laser irradiation. (For interpretation of the references to color in this figure legend, the reader is referred to the Web version of this article.)

