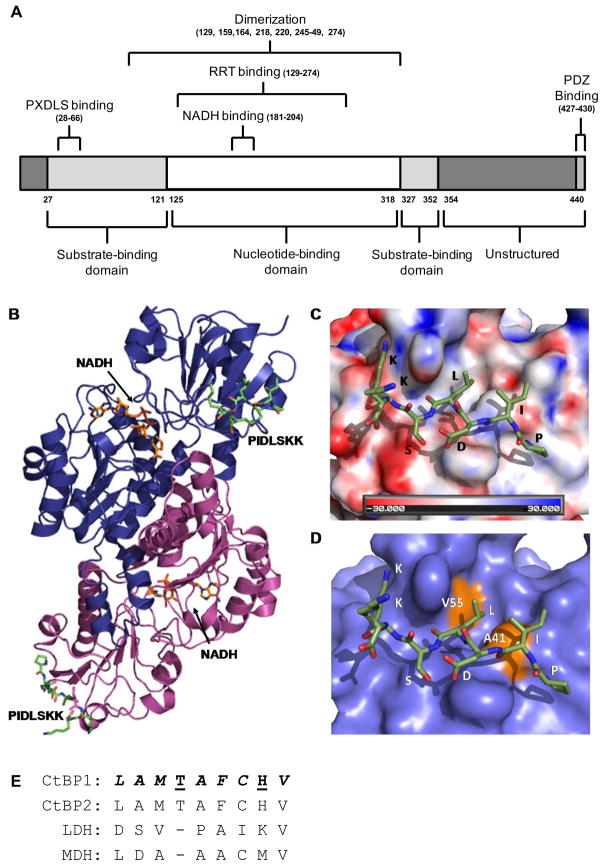
Figure 1. Molecular details of the rat CtBP1-S/E1A peptide interaction.
(A) A domain organization map of CtBP1. Each domain and their corresponding amino acid ranges are listed below the linear map while the binding interfaces and their corresponding amino acid residues or ranges are listed above. (B) The crystal structure of the rat CtBP1-S dimer (blue and purple ribbons) in complex with the PIDLSKK E1A peptide (green) (PDB:1HL3) (18). The NADH cofactor is represented as orange sticks in the center of each CtBP1-S molecule. (C) An electrostatic surface representation of CtBP1-S at the peptide interface. The PIDLSKK peptide is shown as green sticks. (D) A surface representation of CtBP1-S highlighting the location of the two residues, V55 and A41 (orange). Mutation of these residues disrupts the ability of CtBP1-S to interact with E1A. (E) A sequence alignment of different dehydrogenase family members in the CtBP1 region that binds its transcription factor partners. The sequence alignment of CtBP family members and the two other dehydrogenases: lactate (LDH) and malate (MDH) dehydrogenases, was performed using Clustal Omega (122). Residues that make up the hydrophobic binding pocket are italicized, and those that are involved in hydrogen bonds are underlined.

