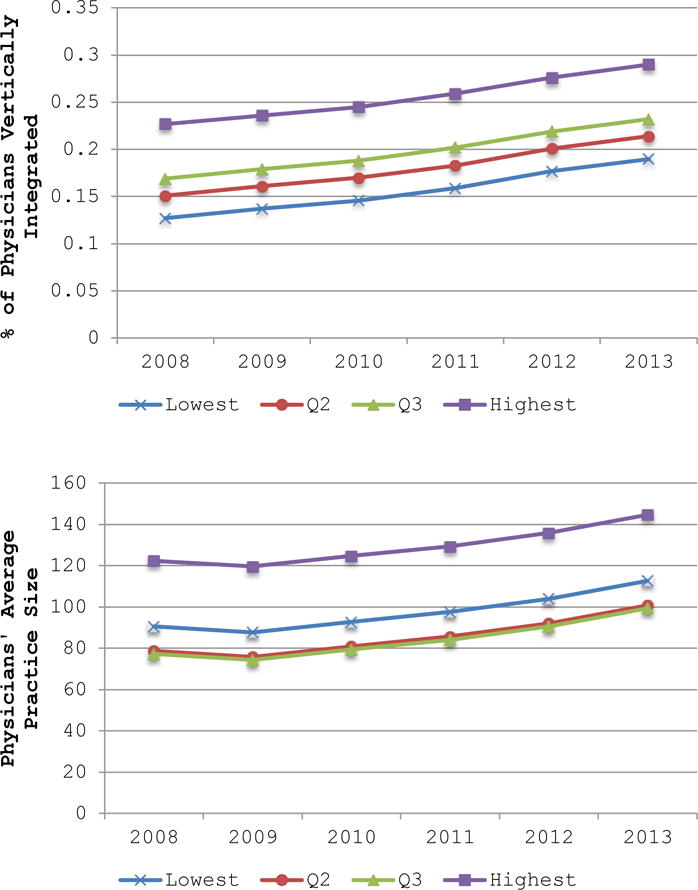
EXHIBIT 2. Provider Market Structure by Quartile of 2014 ACO Penetration, 2008–2013.

SOURCE Authors’ analysis of data from the Centers for Medicare and Medicaid.
NOTES Both panels result from separate between-market analyses, presenting the average annual value of the dependent variable, by quartile of 2014 ACO penetration. Physician’s average group size was calculated as the average count of physicians billing for outpatient care within a TIN, weighting each TIN by its share of total physicians in the MSA. ACO is Accountable Care Organization. TIN is Tax Identification Number.
