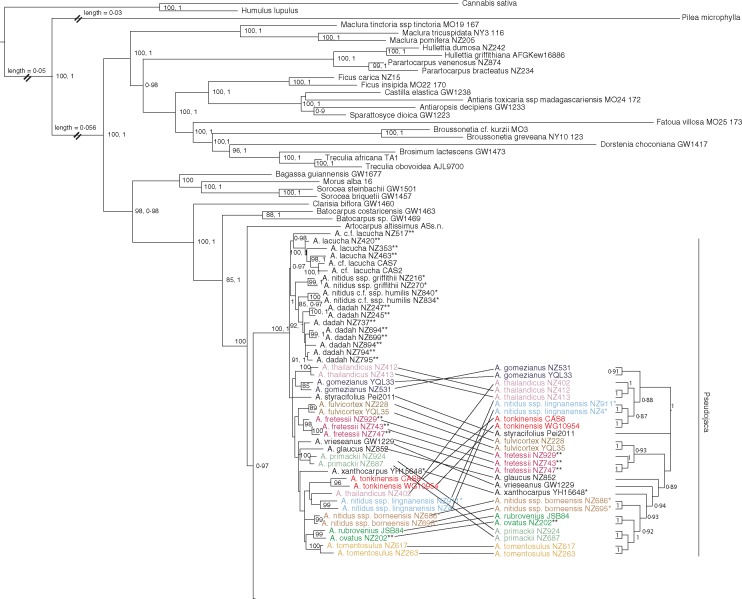
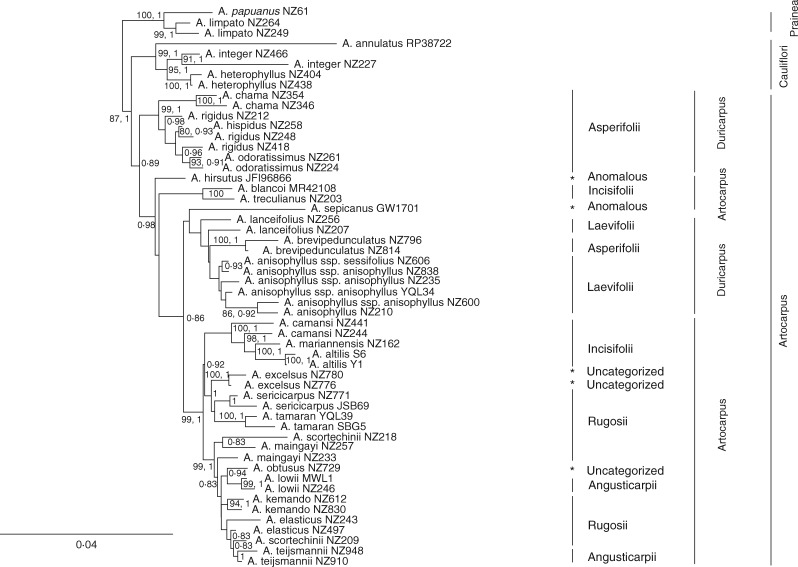
Fig. 2.
Maximum likelihood tree of the genus Artocarpus based on eight loci (six plastid, two nuclear). Numbers after taxon names refer to specific collections (see Table S1 for details). Whole integer bootstrap values (80–100) are from ML analysis, while BI PP ranges from 0·8 to 1. Highly supported portions (>80, 0·8) of the topology agreed in both ML and BI analyses except in one part, where the corresponding BI tree clade is shown for comparison. Names and vertical lines to the right of the tree represent from left to right: series, sections, and subgenera (sensu Jarrett). *A. nitidus sense Berg et al. (2006) and Jarrett (1960). **A. lacucha sense Berg et al. (2006).


