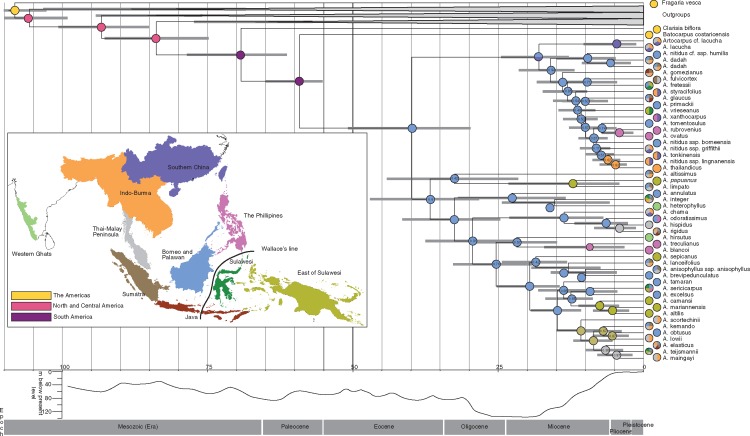
Fig. 3.
Divergence date estimates and ancestral range reconstruction for Artocarpus. Dating, topology and node posterior support are from a BEAST analysis using six fossil calibrations and a constrained root. Error bars are 95 % confidence intervals. All nodes have posterior probability (PP) of 1·0 except where noted on the node. Coloured circles are the most likely state of a Lagrange ancestral area reconstruction allowing two areas per node. Pie charts at tips indicate the extent of the range for the indicated taxon. Sea level graph from Lambeck and Chappell (2001).

