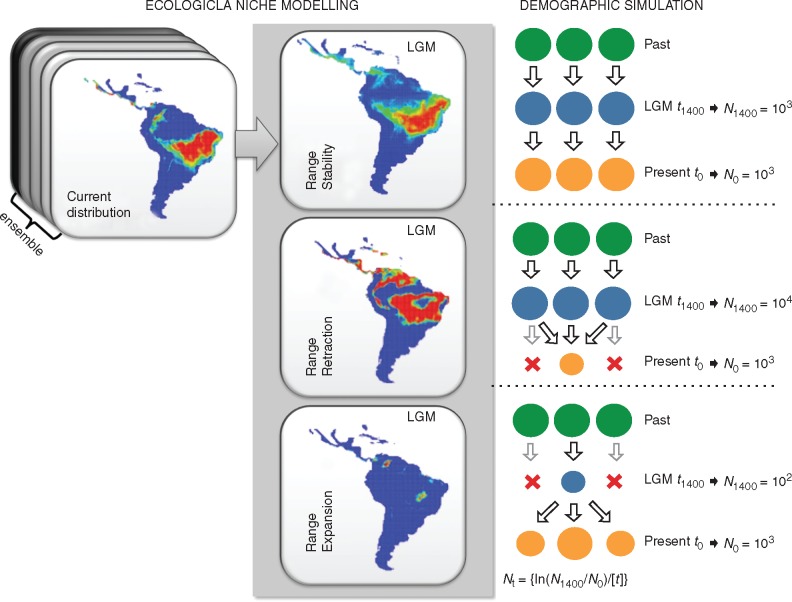
Fig. 2.
Schematic representation the demographic history scenarios simulated for the 23 populations of Eugenia dysenterica sampled in the Cerrado biome, and their geographical representation as predicted by ecological niche models (ENMs). Circles represent hypothetical demes and indicate population stability or shrinkage through time. LGM, Last Glacial Maximum; Pres, present-day; N0, effective population size at time t0 (present); N1, effective population size at time t1400 (1400 generations ago); Nt, logarithmic function for effective population size variation in coalescent simulation. The migration rate was 0·01 per generation.

