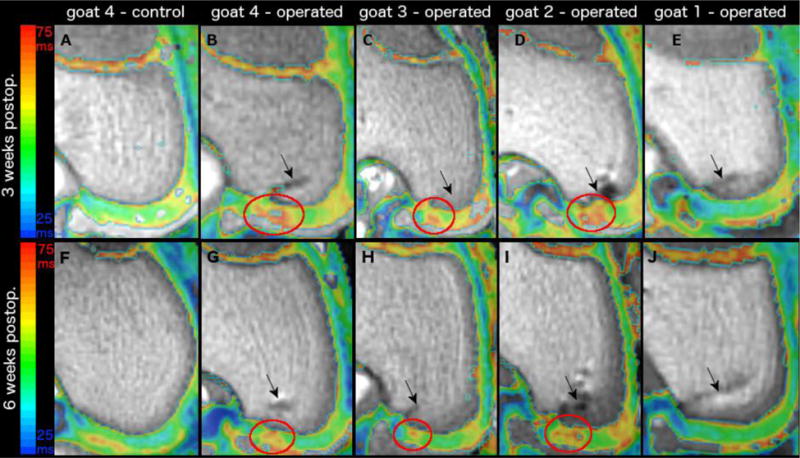
Figure 1.

depicts color T2 maps (beneath which is the reference gray scale image generated from the shortest echo image of the T2 mapping sequence) obtained in vivo in a 3T MR scanner in the coronal plane 3 weeks (first row) and 6 weeks (second row) after vascular interruption surgery in four goats. Panels A and F demonstrates normal epiphyseal cartilage of the medial femoral condyle in the left unoperated (control) limb of goat 4. Red ovals mark areas of increased relaxation time, consistent with ischemic cartilage necrosis, in the operated right medial femoral condyle of goats 4 (panels B and G), 3 (panels C and H), and 2 (Panels D and I). The epiphyseal cartilage appears normal in goat 1 (Panel E and J) where surgical interruption of the vascular supply to the medial femoral condyle failed. Black arrows indicate the surgical scars (Panels B–E and G–J).
