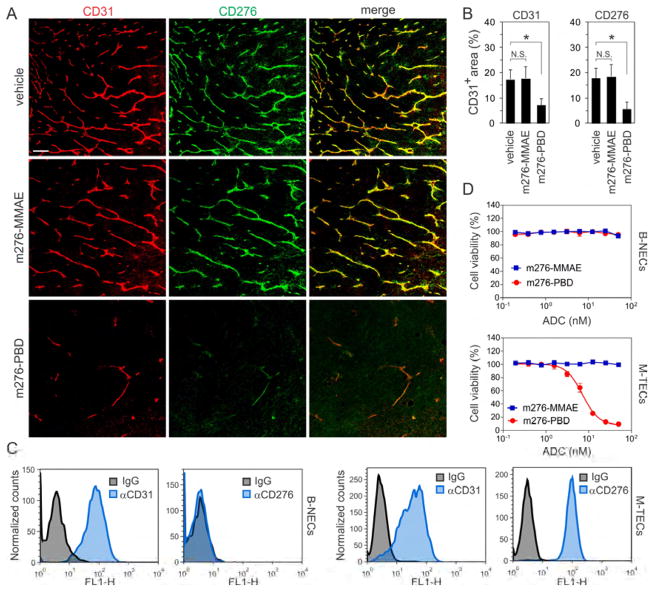
Figure 4. CD276 ADC Activity against CD276+ Tumor Endothelium.
(A) CD276 (green) and CD31 (red) IF staining of MC38 tumors 48 hr post treatment with vehicle (control), m276-MMAE (3 mg/kg) or m276-PBD (1 mg/kg). Scale bar: 100μm.
(B) Mean vessel area (% of field) in MC38 tumors 48 hr post treatment with vehicle (control), m276-MMAE or m276-PBD. N.S.; non-significant. n = 25 fields/group, *p<0.001.
(C) Flow cytometry was used to measure CD276 or CD31 levels in bEnd.3 Normal ECs (B-NECs) or MC38 Tumor ECs (M-TECs).
(D) Cell viability of B-NECs or M-TECs following treatment with m276-MMAE and m276-MMAE. Error bars in (B) and (D) = SD.
See also Figure S6.

