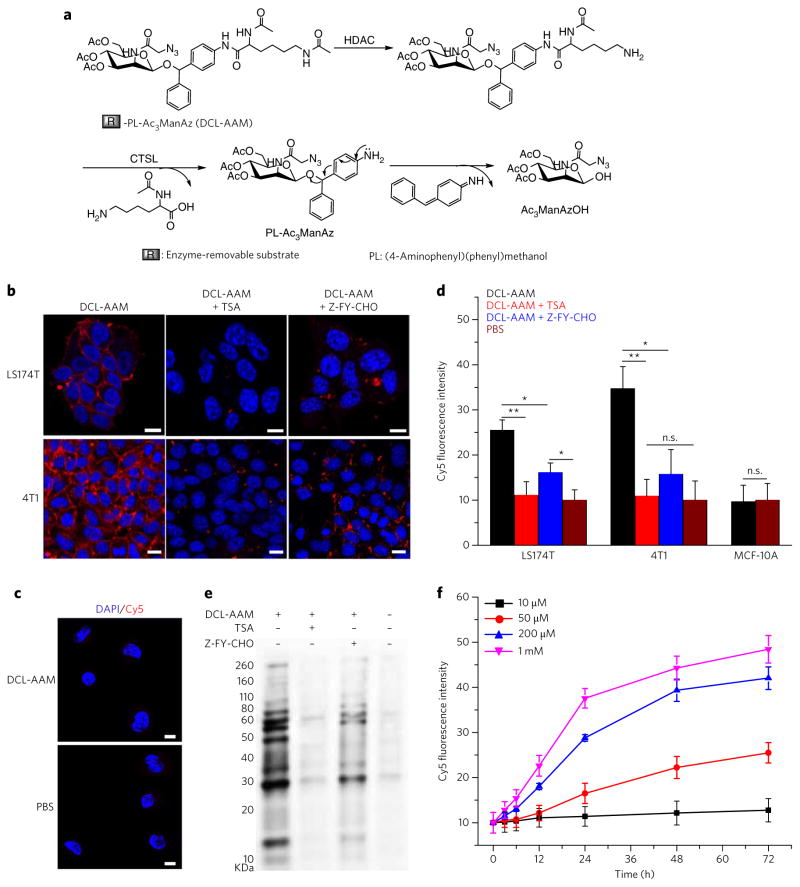
Figure 3. DCL-AAM-mediated cancer-selective labeling in vitro.
(a) Schematic illustration of HDAC/CT SL-induced degradation of DCL-AAM. HDAC removes the N6-acetyl group of the lysine residue first, which is followed by cleavage of the C1-amide bond by CT SL and self-cleavage of (4-aminophenyl) (phenyl)methanol (PL) to release Ac3ManAzOH. (b, c) CLSM images of LS174T and 4T1 cells (b) and MCF-10A breast basal epithelial cells (c) after incubation with DCL-AAM (50 μM), DCL-AAM (50 μM) + TSA (1 μM), DCL-AAM (50 μM) + Z-FY-CHO (50 μM), or PBS for 72 h and treatment with DBCO–Cy5 (50 μM, red) for 1 h. The cell nuclei were stained with DAPI (blue). Scale bars, 10 μm. (d) Average Cy5 fluorescence intensity of LS174T, 4T1 and MCF-10A cells following the same treatment as described in b and c. Data are presented as mean ± s.e.m. (n = 6) and analyzed by one-way ANOV A (Fisher; 0.01 < *P ≤ 0.05; **P ≤ 0.01; ***P ≤ 0.001). The PBS group as the negative control was normalized to 10. (e) Western blotting analysis of LS174T cells after treated with DCL-AAM, DCL-AAM + TSA or DCL-AAM + Z-FY-CHO for 72 h. Cell lysates were incubated with DBCO–Cy3 for 1 h at 37 °C before gel running. Protein bands were visualized using ImageQuant LAS 4010 system. (f) Concentration- and time-dependent DCL-AAM-mediated labeling in LS174T cells (n = 4). LS174T cells were treated with various concentrations of DCL-AAM (10, 50, 200 and 1 mM) for different time (0, 3, 6, 12, 24, 48 and 72 h), and labeled with DBCO–Cy5 (50 μM) for 1 h. Each experiment was repeated 2–3 times in triplicate for each group; the data from the representative experiment are used to prepare the figure and are presented as mean ± s.e.m.

