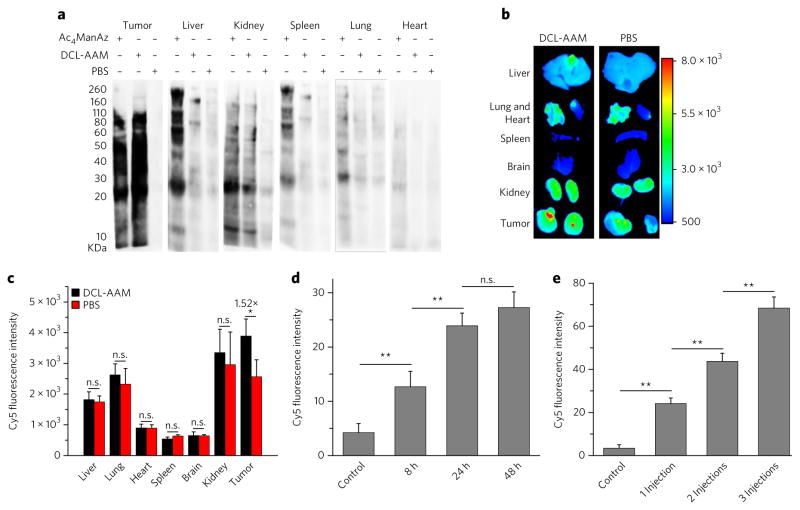
Figure 4. DCL-AAM mediated cancer-selective labeling in vivo.
(a–c) DCL-AAM (60 mg/kg), Ac4ManAz (40 mg/kg) or PB S was i.v. injected into athymic nude mice bearing subcutaneous LS174T tumors once daily for 3 d. At 24 h after the last injection, the metabolic expression of azido groups in tumor tissues was analyzed by western blotting (a) or by monitoring the biodistribution of i.v.-injected DBCO–Cy5 (5 mg/kg) (b, c). (a) Western blotting analysis of tissues harvested from mice treated with Ac4ManAz, DCL-AAM or PBS. Tissue lysates were incubated with DBCO–Cy3 for 1 h at 37 °C before the gel was run. Protein bands were visualized using ImageQuant LAS 4010 system. (b) Ex vivo fluorescence imaging of tissues harvested from mice treated with DCL-AAM or PBS at 48 h p.i. of DBCO–Cy5. (c) Average Cy5 fluorescence intensity of tissues (n = 3) from (b). (d) Normalized Cy5 fluorescence intensity of LS174T tumor tissues (20 sections per tumor, n = 3) harvested and sectioned from mice at 8, 24 and 48 h p.i. of DCL-AAM (60 mg/kg), respectively. Tumor tissue sections were labeled with DBCO–Cy5 for 30 min. (e) Normalized Cy5 fluorescence intensity of LS174T tumor tissues (20 sections per tumor, n = 3) harvested from mice with 0, 1, 2 and 3 DCL-AAM injections (60 mg/kg, 24 h interval). Tumor tissue sections were labeled with DBCO–Cy5 for 30 min. All the numerical data are presented as mean ± s.e.m. and analyzed by one-way ANOV A (Fisher; 0.01 < *P ≤ 0.05; **P ≤ 0.01; ***P ≤ 0.001).

