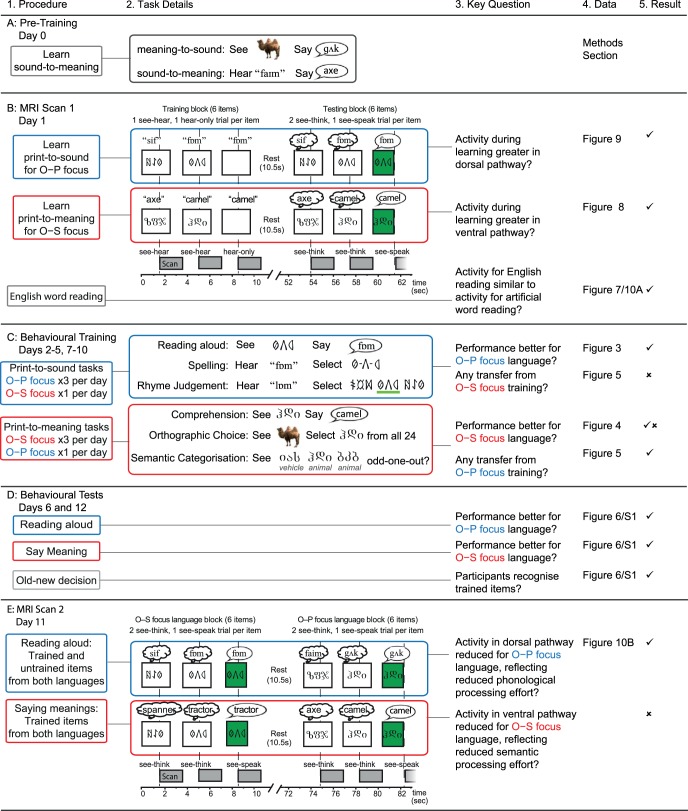
Figure 2.
Overview of procedures, task details, key questions, data sets, and results for each part of the experiment. Column 1 gives an overview of each training procedure. Column 2 gives further details of the behavioral and MRI protocols. In rows B and E, which show the trial format and timing during MRI scans, dotted lines indicate correspondence between stimulus presentation and scan onset. Black outlined boxes show what participants were viewing, and what they were hearing, thinking, or saying is shown above each box. Column 3 delineates the key questions addressed by each part of the experiment, column 4 shows where the results can be found, and in column 5 ticks and crosses indicate whether each prediction was confirmed by the data. See the online article for the color version of this figure.

