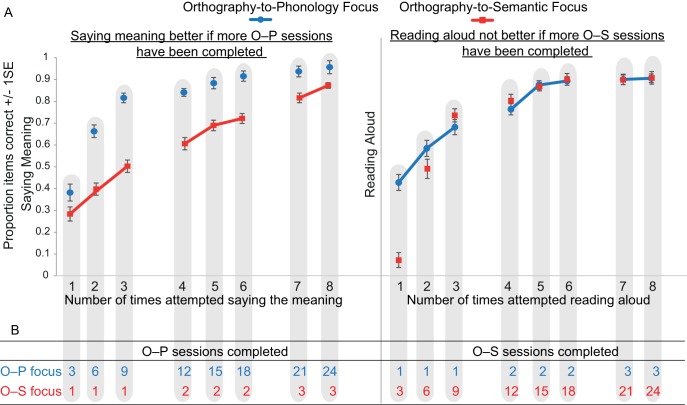
Figure 5.
Replotting of data shown in the top left graphs of Figures 3 and 4 to illustrate how having completed relatively more O–P training sessions benefits saying the meanings (left panel), whereas having completed relatively more O–S training sessions does not benefit reading aloud (right panel). Graphs show the proportion of items correct in saying the meaning (left panel) and in reading aloud (right panel) the first eight times (after the initial scanning session) participants completed these tasks for the O–P and O–S focus languages. Joined up points indicate that sessions were completed on the same day, whereas separated points indicate that sessions were completed on different days. The information in the table that is connected to the graphs by gray lozenges shows how, when the number of times saying the meaning is equated, participants have received relatively more O–P training for the O–P than the O–S focus language (left panel). Conversely, when the number of times reading aloud is equated, participants have received relatively more O–S training for the O–S than the O–P focus language (right panel). See the online article for the color version of this figure.

