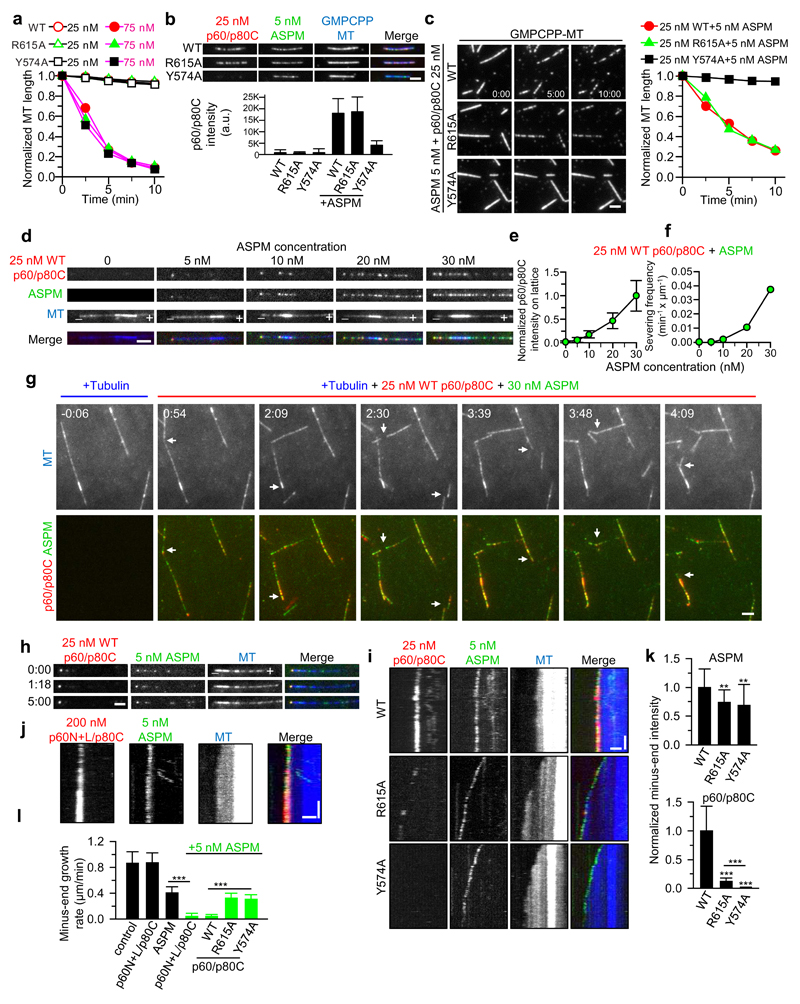
Figure 7. The ASPM/katanin complex severs microtubules and blocks minus-end growth in vitro.
(a) Quantification of microtubule severing activity of 25 nM (black lines) and 75 nM (purple lines) p60/SNAP-Alexa647-p80C (wild type (WT) and mutants). For microtubule images, see Supplementary Fig. 6c. Data are the mean of 2 experiments.
(b) Images and quantification of the recruitment of 25 nM p60/SNAP-Alexa647-p80C (red) to GMPCPP-stabilized microtubules (blue) in the presence of 5 nM GFP-ASPM (green). From left to right, n=47, 47, 49, 49, 45 and 52 microtubules.
(c) Images and quantification of microtubule severing activity of 25 nM p60/SNAP-Alexa647-p80C (WT and mutants) in the presence of 5 nM GFP-ASPM. Data are the mean of 2 experiments
(d) Images showing recruitment of WT p60/SNAP-Alexa647-p80C onto dynamic microtubule minus ends and lattices by GFP-ASPM at different concentrations.
(e) Quantification of microtubule lattice intensity of WT p60/SNAP-Alexa647-p80C at different ASPM concentrations. From left to right, n=65, 63, 71, 65 and 64 microtubules.
(f) Quantification of severing activity of WT p60/SNAP-Alexa647-p80C at different ASPM concentrations. Data are the mean of 2 experiments.
(g) TIRFM time lapse images of severing of dynamic microtubules by 25 nM WT p60/SNAP-Alexa647-p80C and 30 nM GFP-ASPM. White arrows indicate severing events.
(h) Images showing recruitment of WT p60/SNAP-Alexa647-p80C to dynamic microtubule minus ends by 5 nM GFP-ASPM.
(i,j) Kymographs showing localization of GFP-ASPM and WT p60/SNAP-Alexa647-p80C, R615A and Y574A mutants (i) or p60N+L/SNAP-Alexa647-p80C (j) to dynamic microtubule minus ends. Vertical scale bar, 1 min.
(k) Quantification of ASPM and p60/SNAP-Alexa647-p80C intensities on minus ends. From left to right, ASPM, n=32, 19 and 19 microtubule; p60/p80C, n=33, 19 and 19 microtubules.
(l) Quantification of minus-end growth rate in conditions with 200 nM p60N+L/p80C alone, 5 nM ASPM alone, and 5 nM ASPM together with 200 nM p60N+L/p80C or 25 nM p60/p80C (WT, R615A and Y574A). From left to right, n=49, 41, 38, 55, 58, 96, 84 microtubules. The data for control were re-plotted from Fig. 5f.
Horizontal scale bars in all panels, 2 μm. Data represent mean ± SD. **, P<0.01; ***, P<0.001, Mann-Whitney U test. Time in min:sec. Source data for panels a, b, c, e, f, k and l can be found in Supplementary Table 5.

