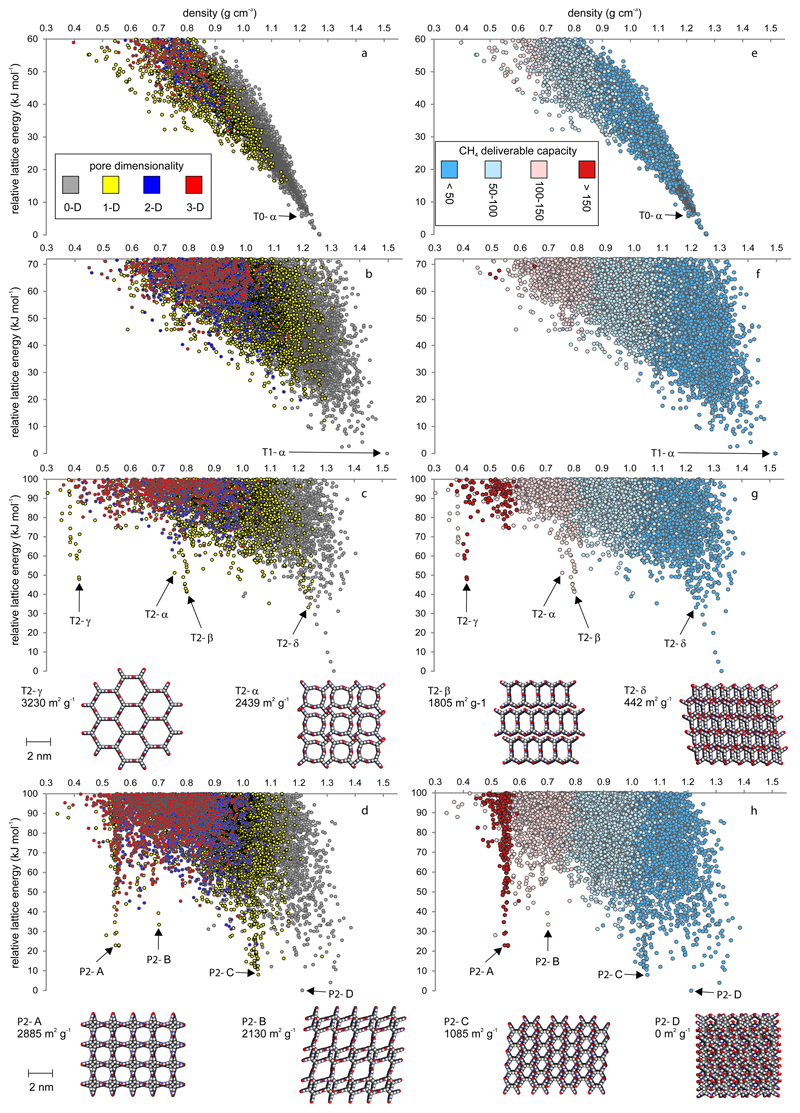
Figure 2. From structure prediction to energy–structure–function maps.
a–d, CSP energy-density plots for a, T0; b, T1; c, T2, and; d, P2, where each point corresponds to a computed crystal structure. T2, c, and P2, d, structures selected from the leading edge of the energy also shown. The symbols are color coded by pore channel dimensionality, assessed using a CH4 probe radius, 1.7 Å. e–h, Energy–structure–function (ESF) maps showing the calculated methane deliverable capacities for e, T0; f, T1; g, T2, and; h, P2, projected onto the energy-density plot. Symbols color coded by deliverable capacity (v STP/v, 65–5.8 bar, 298 K).

