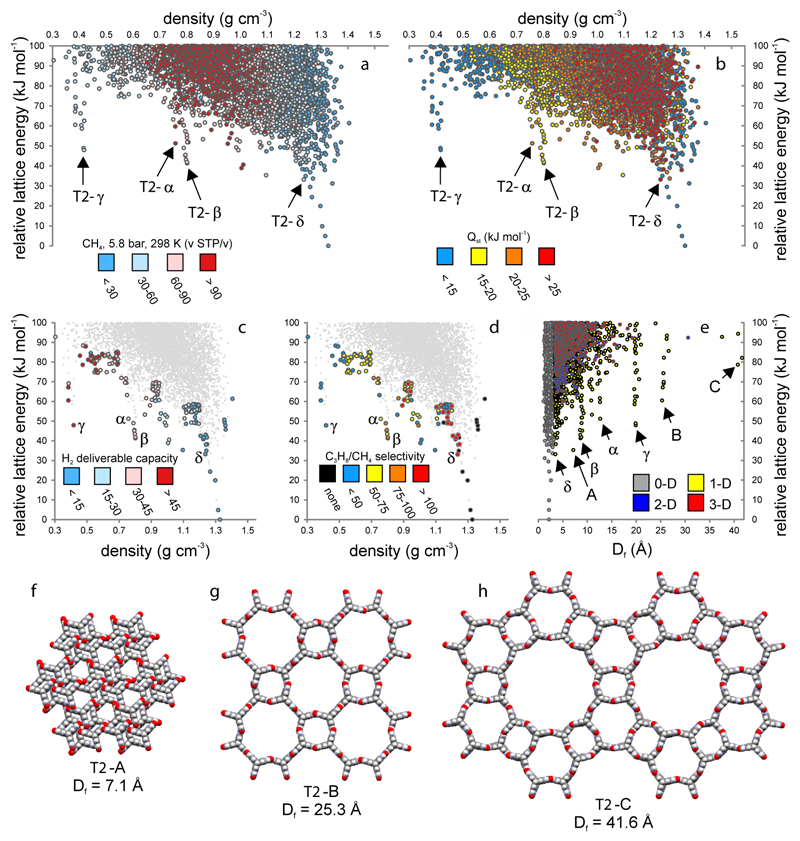
Figure 3. Energy–structure–function maps for T2.
a, Volumetric methane capacity at 5.8 bar/298 K (the depletion pressure). b, Isosteric heat of adsorption for methane. c, Calculated H2 deliverable capacity (kg m-3, 100 bar/77 K, 5 bar/160 K) for structures selected from the leading edge of the ESF; T2-γ is favoured. d, Simulated propane/methane selectivity (1 bar/298 K); T2-β and T2-δ are favoured. e, Relative lattice energy vs Df, the largest free sphere, which relates to pore size; symbols colored by pore dimensionality. (f–h) Selected hypothetical structures from the leading edge: T2-A, T2-B and T2-C correspond to labels A, B and C in e.

