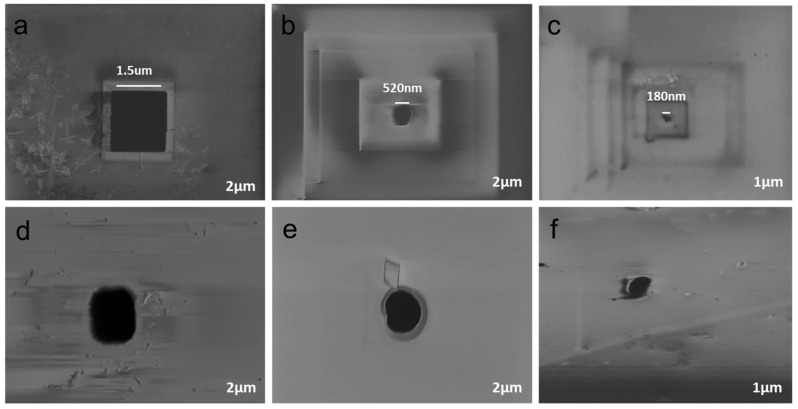
Figure 4.
SEM images of fabricated pores in a thin Si membrane. (a–c) Front view; and (d–f) rear view. (a,d) 1.53 ± 0.11 µm under J = 4.91 mA/cm2 with 15% HF in an aqueous electrolyte; (b,e) 520 ± 35 nm under J = 1.57 mA/cm2 with 10% HF in an aqueous electrolyte; and (c,f) 180 ± 12 nm under 0.47 mA/cm2 with 5% HF in an aqueous electrolyte.

