
Figure 3.
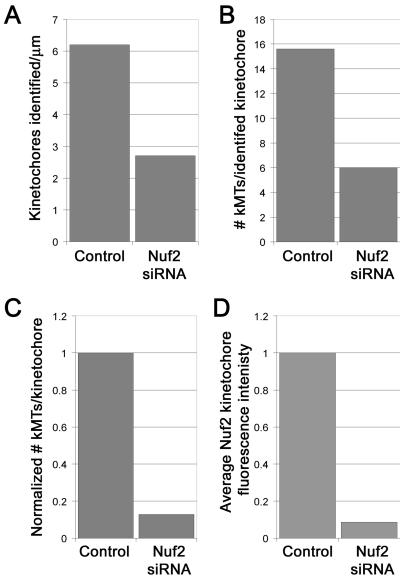
Quantification of microtubule binding to kinetochores in control versus Nuf2-depleted cells. The numbers of kinetochores identified per micrometer of cell sectioned (A), and the number of microtubules per kinetochore (B), were averaged for control (n = 2 cells; 32 kinetochores) and Nuf2 siRNA-transfected cells (5 cells; 28 kinetochores). Kinetochore-microtubule numbers in Nuf2 siRNA-transfected cells were normalized to kinetochore-microtubule numbers in control cells by assigned a value of zero attached microtubules to the “unidentified kinetochores” (C). The average reduction of kinetochore-microtubules detected by EM in C is similar to the average reduction in Nuf2 at kinetochores in siRNA-transfected HeLa cells as measured by immunofluorescence microscopy (D).