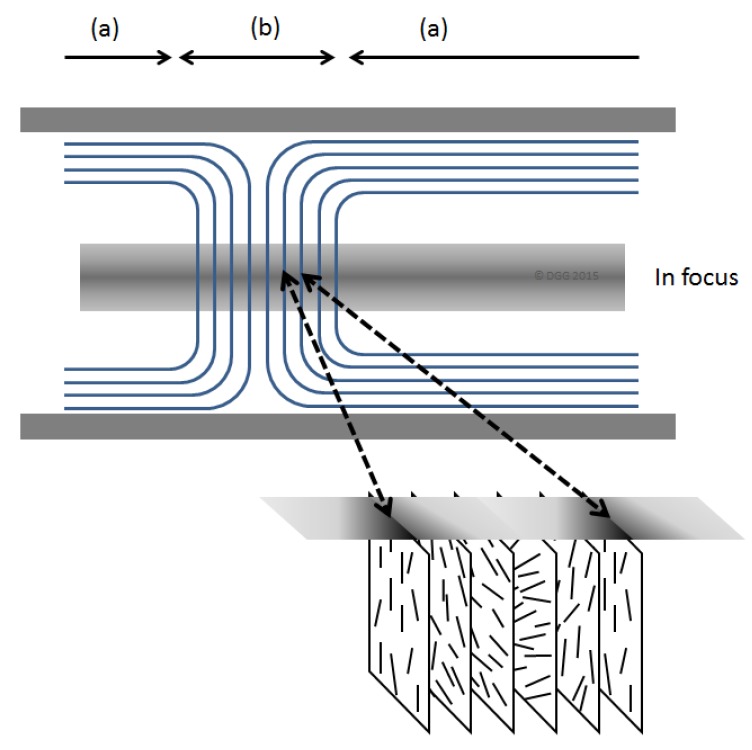
Figure 2.
Simplified sketch of organization of chiral nematic textures shown in Figure 1. Regions (a) and (b) correspond to planar and fingerprint textures, respectively. The optical axis of the microscope is from top to bottom of the sketch, with the middle of the sample in focus. The light and dark lines under crossed polars originate from variations in birefringence due to the orientation of the cellulose nanocrystals (CNCs) along and across the microscope optical axis [8].

