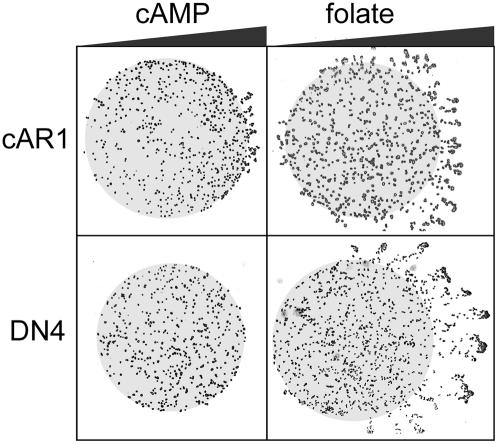
Figure 5.

Chemotaxis to cAMP and folate. Droplets (∼0.5 μl) containing either cAR1 or DN4 cells were spotted on agar (0.8% in PB) ∼1-2 mm from paper discs (not depicted) soaked with 50 μM cAMP or 0.5 mM folate as indicated. Pulse-developed cells and PB-washed vegetative cells were used for cAMP and folate chemotaxis, respectively. After 3-5 h, the cells were photographed using an inverted microscope. The resulting images were contrast-enhanced to improve cell visibility and overlaid on gray circles indicating the boundaries of the cell droplets. Triangles symbolize the expected chemoattractant gradient.
