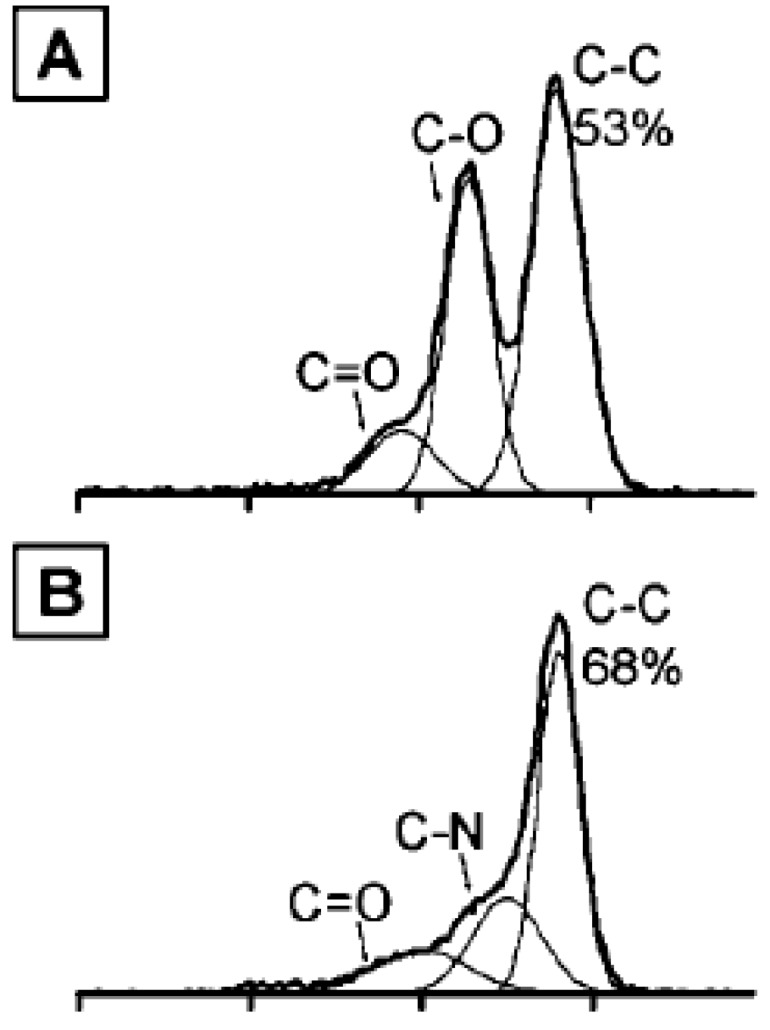
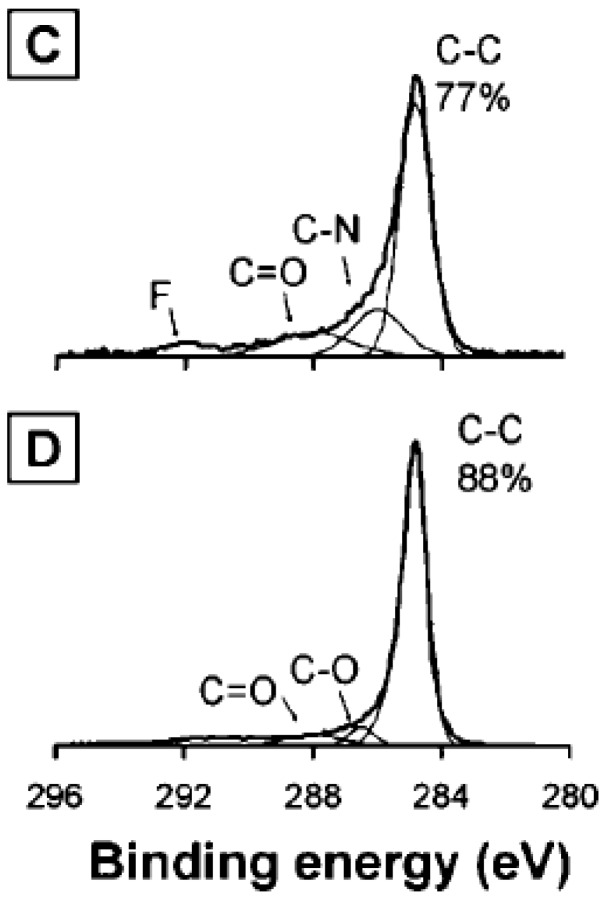
Figure 7.

XPS analysis of the reduced graphene oxide films after different reduction treatments. (A) Non-reduced film; (B) Hydrazine-reduced film; (C) Film reduced by hydrazine and annealing at 400 °C; (D) Film reduced by annealing at 1100 °C. Reprinted with permission from [88]. Copyright (2008) by the American Chemical Society.

