
Figure 5.
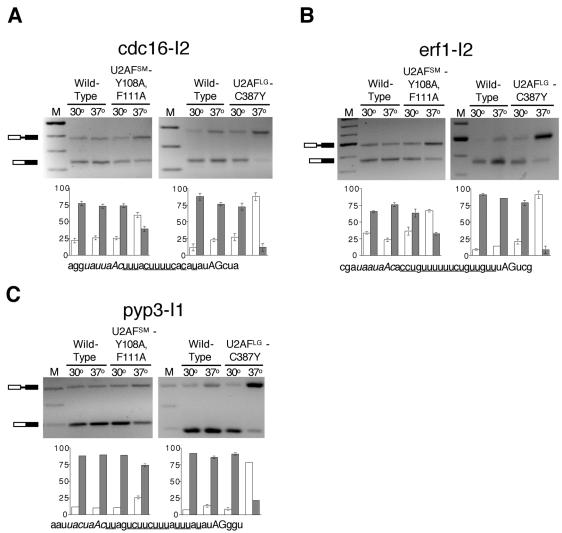
RT-PCR assays of cdc16-I2, erf1-I2, and pyp3-I1 splicing in the ts spU2AFSM and spU2AFLG mutants. (A) Top left: gel electrophoretic analysis of products from cdc16-I2 in the spU2AFSM [Y108A, F111A] mutant. Bottom left: histogram showing quantitation of RT-PCR data with percent precursor mRNA indicated by white bars and percent mature mRNA indicated by black bars. Error bars, SD for three RT-PCR splicing assays. (Right: as in the left panels except that the experiment was performed with the spU2AFLG C387Y mutant. Bottom: the sequence of the 3′ end of cdc16-I2 with the branchpoint sequence indicated in italics, the pyrimidine tract underlined, and the terminal AG in uppercase. (B) As in A except that the splicing data are for erf1-I2. (C) As in A except that the splicing data are for pyp3-I1.