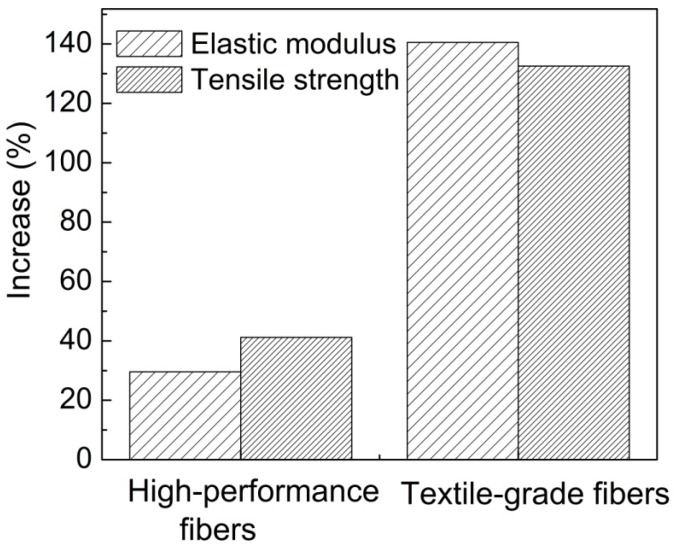
Figure 4.
Average percent increase comparison between control fibers (no fillers) and composite fibers for both the Young’s modulus and tensile strength properties. The graph compares the differences in percent increase for the high-performance and textile-grade polymeric fiber materials [35,36,38,39,40,41,42,43,44,45,46,47,112,113,114,115,116].

