
Figure 5.
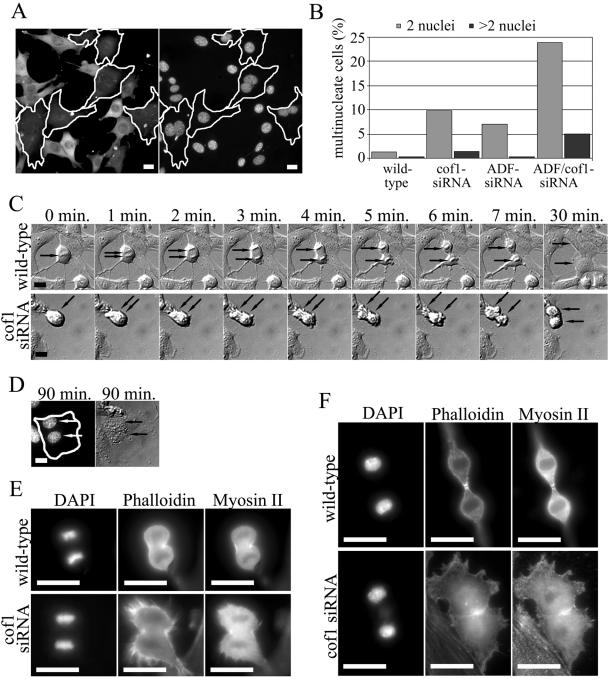
Cofilin-1 and ADF play overlapping roles in cytokinesis. (A and B) Wild-type and cofilin-1 or ADF knockdown NIH 3T3 cells were fixed, and DNA was visualized by DAPI staining. (A) Representative examples of a cofilin-1 knockdown cells (cell borders are indicated by white lines). Cofilin-1 was visualized with an anti-cofilin-1 antibody (left), and DNA with DAPI staining (right). (B) The number of multinucleated cells was counted from at least 700 wild-type and knockdown cells from four independent experiments. The depletion of ADF or cofilin-1 resulted in a small increase in the number of multinucleated cells, whereas the silencing of both genes resulted in a synergistic increase in the amount of multinucleated cells. (C) Time-lapse analysis of cytokinesis of wild-type (top and Supplementary Video 1) and cofilin-1 knockdown (bottom and Supplementary Video 2) NIH 3T3 cells. Frames “0 min.” represent metaphase. Black arrows indicate the positions of chromosomes. Wild-type cells undergo cell division and spreading within 30 min after the metaphase (last frame in C), whereas the process in cofilin-1 knockdown cell is significantly slower and the cell spreading is complete after ∼90 min of metaphase. Supplementary videos display the entire division processes. (D) The same cofilin-1 knockdown cell as shown in C was fixed and stained with cofilin-1 antibodies and with DAPI (first panel) to visualize the two nuclei present in the cofilin-1 knockdown cell. (E and F) Visualization of F-actin and myosin II during cytokinesis in wild-type and cofilin-1 knockdown cells. Wild-type and cofilin-1 knockdown B16F1 cells were fixed, DNA was visualized by DAPI, F-actin by phalloidin, and myosin II by an anti-myosin II antibody. Representative cells undergoing telophase (E) and late telophase (F) are shown. Bars, 20 μm.