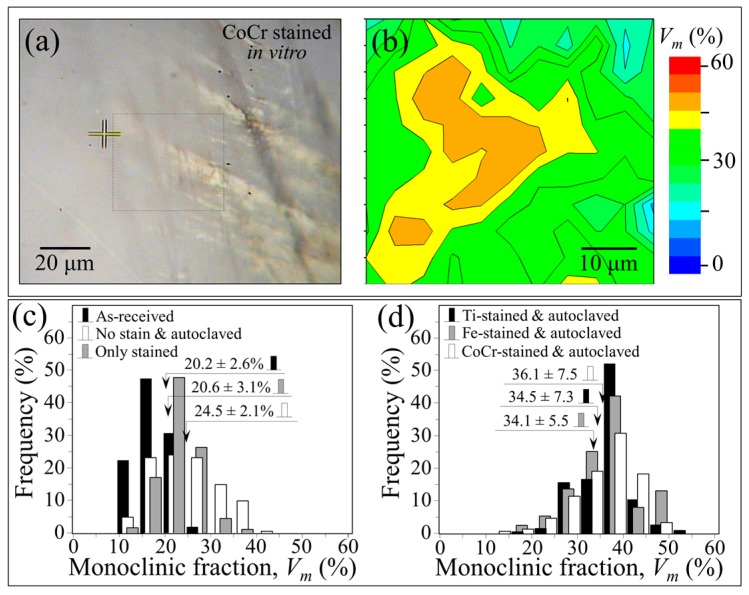
Figure 9.
(a) Optical micrograph of the surface of a CoCr-stained ZTA femoral head and Raman map; and (b) obtained in the vicinity of the CoCr stain in correspondence of the squared inset of (a); (c) satistical histograms of monoclinic fractions for the same ZTA head in (a) as-received, autoclaved without staining, and CoCr-stained before autoclaving; and statistical histograms comparing monoclinic fractions after staining and autoclaving for CoCr, Fe, and Ti (d).

