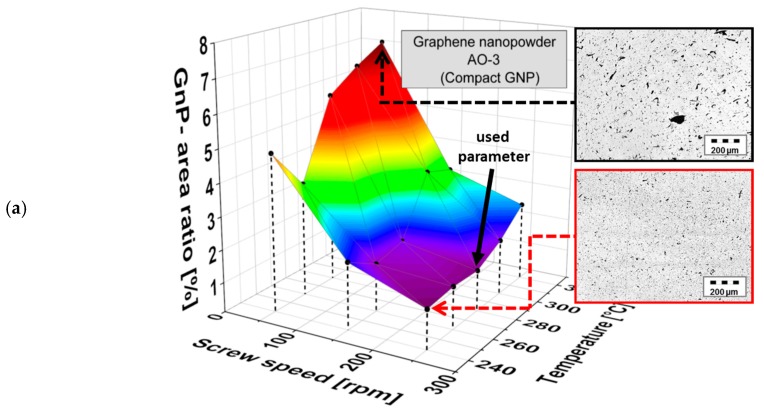
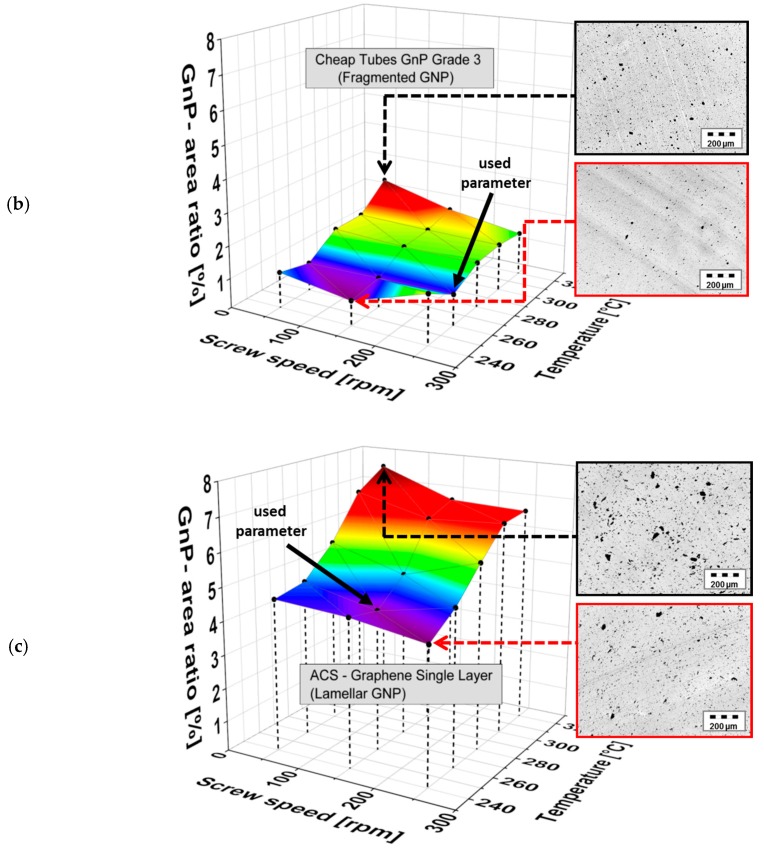
Figure 8.
Comparison of the area ratio of microscopically visible GNP structures of different GNP morphologies in PC as a function of screw speed and melt temperature (a) Graphene nanopowder AO-3, (b) Cheap Tubes GNP Grade 3 and (c) ACS-Single Layer Graphene (filler content 1 wt %, mixing time 5 min) together with light microscopy images indicating the state of dispersion for selected processing parameters (cuts performed perpendicular to the strand direction).


