
Figure 4.
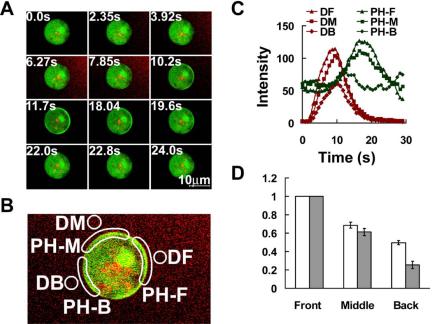
PHCrac-GFP translocation in response to acute exposure to a cAMP gradient. (A) A pulse of cAMP was released by applying a pressure increase from a nearby micropipette and sequential fluorescence images were captured to monitor PHCrac-GFP distribution and cAMP concentration represented as Alexa 594 intensity. Numbers in the top left corner are seconds after cAMP release of the selected frames. Supplementary Video video5.avi presents the complete sequence from this experiment. Frames were captured at 785-ms intervals and are replayed at five frames/s. (B) DF, DM, and DB represent the selected front, middle, and back regions surrounding the cell used for quantitative measurement of dynamic changes of cAMP concentration. PH-F, PH-M, and PH-B show the membrane regions for measuring PHCrac-GFP translocation responses to this asymmetrical cAMP stimulation. (C) Time course of changing cAMP concentration and of membrane translocation of PHCrac-GFP in the different regions of a cell. (D) Quantitative analyses of the relationship between the peak value of cAMP stimulation and the peak value of the PHCrac-GFP membrane association in each region of response of PHCrac-GFP translocation was normalized by dividing the peak value of PH-F, the maximal local response. Data were obtained from 16 independent experiments. Means ± SE are shown.