
Figure 9.
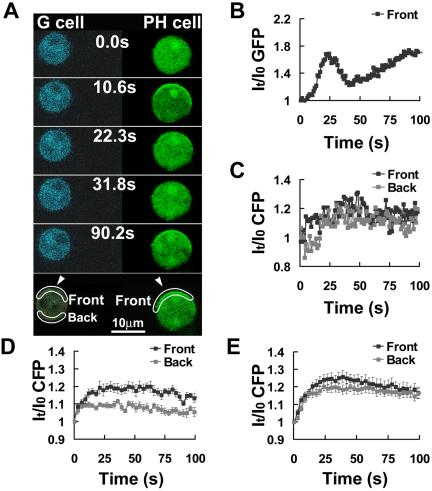
G-protein activation after a sudden exposure to a steady cAMP gradient. (A) Comparison of G-protein activation (CFP images) and PHCrac-GFP translocation. Frames were captured at 1.06-s intervals and selected frames were shown. Regions of interest for the data reported in B and C are also shown. (B) Dynamics of the PHCrac-GFP membrane association in the front of the PH cell. (C) G-protein activation in the front (black) and back (gray) of the G cell, measured as the increase of CFP intensity. Similar results were obtained five times. (D) and (E) Kinetics of G-protein dissociation in the front and back of cells in response to cAMP gradients with different steepness but similar cAMP concentration in the front of the cells. Micropipette filled with 1 or 3 μM of cAMP was moved from 1500 μm away to ∼10 μm (D) or 50 μm (E) from the cells at 0 s. These movement generated gradients with similar cAMP concentration in the front of the cells but different steepness of ∼100% (D) or 20% (E), respectively, which were estimated from the measurement of a stable gradient shown in Supplementary Figure S2. G-protein activation in the front (black) and back (gray) of G cells, measured as the increase of CFP intensity, are shown. Means ± SE of each time point (n = 10 and 18 for D and E, respectively) are shown as temporal changes in the G-protein dissociation in the front and back after stimulation. To estimate the relative difference in G-protein activation, after reaching the steady states, between the front and back side of cells, we first calculated Means, ∑It/I0CFP/n, where n is the number of the time points; the first time point is 27s and the last time point is 100 s. (D) 118.4 ± 1.3% (front) and 108 ± 1.7% (back); (E) 121.5 ± 2.7% (front) and 118 ± 1.4% (back). Relative difference in D: (118.4% - 1)/(108% - 1) - 1 = 130%; in E: (121.5% - 1)/(118% - 1) - 1 = 19.3%.