
Figure 5.
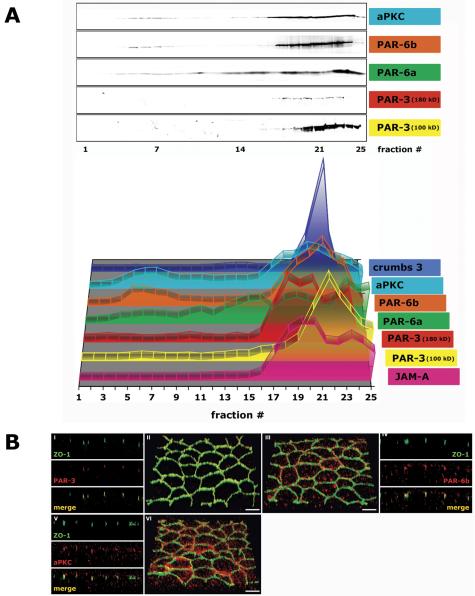
Polarity proteins of the AJC in polarized epithelia (3 d after cell-cell adhesion). MDCK cells were grown as confluent monolayers on Transwell filters for 3 d after cell-cell adhesion. (A) 10-20-30% iodixanol gradient. Signal intensity for each protein band was determined as integrated intensity (counts/mm2) and expressed as percentage of the sum of Integrated Intensities in fractions 1-25 (see Materials and Methods for details). In the 3-D graph, the y-axis (arbitrary units) is omitted to increase clarity of the graphical display. (B) Immunofluorescence. II/III/VI are 3-D reconstructions of confocal z-stacks in a 45°-angled view. I/IV/V are z-sections of corresponding 3-D reconstructions. Bar, 5 μm.