
Figure 9.
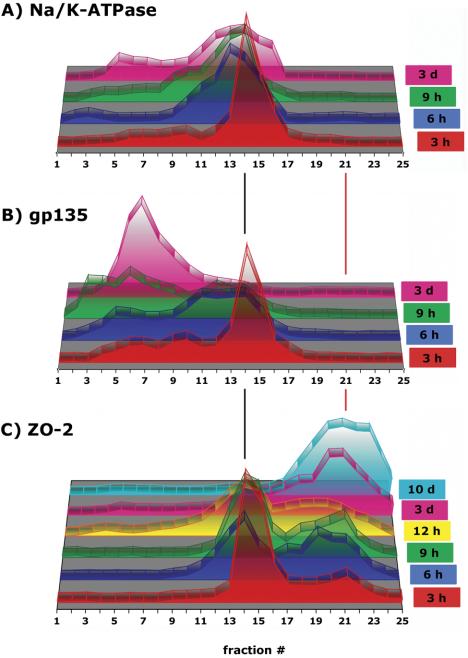
Distribution of proteins in 10-20-30% iodixanol gradients during formation of AJC. MDCK cells were grown as confluent monolayers on Transwell filters for time points indicated after cell-cell adhesion. After separation of fraction samples by SDS-PAGE followed by immunoblotting, signal intensity for each protein band was determined as integrated intensity (counts/mm2) and expressed as percentage of the sum of integrated intensities in fractions 1-25 (see Materials and Methods for details). In the 3-D graph, the y-axis (arbitrary units) is omitted to increase clarity of the graphical display.