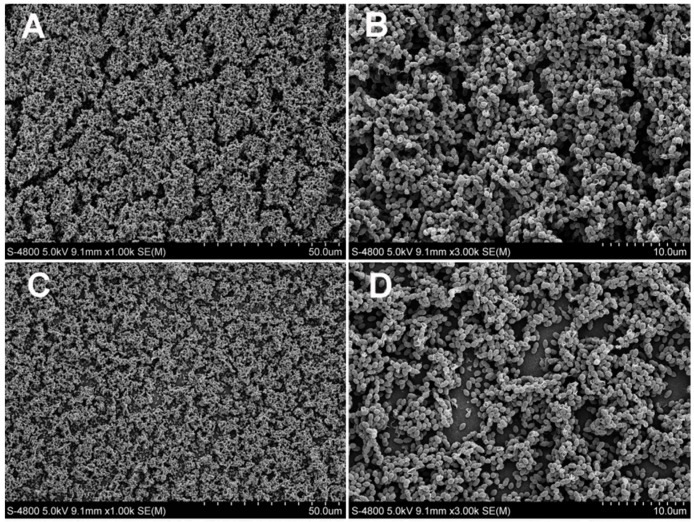
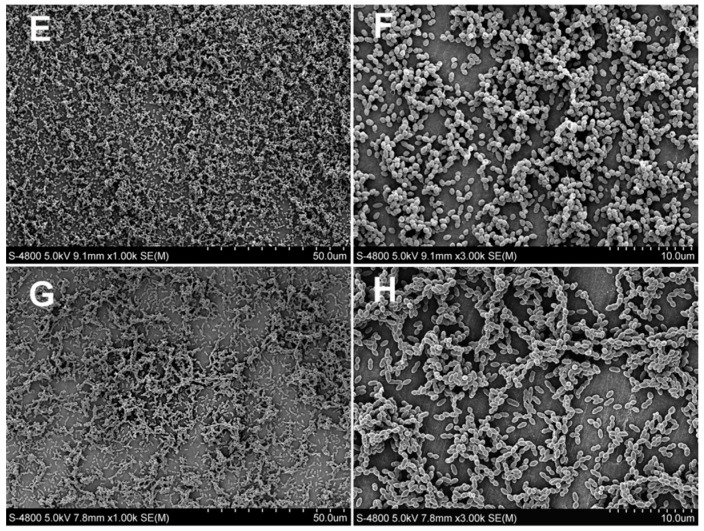
Figure 2.
The scanning electron micrographs (magnification 1000× and 3000×) of Streptococcus mutans biofilms on the specimens in the control group and in the EGCG groups: SB 2 (A,B); EGCG 200 (C,D); EGCG 400 (E,F); and EGCG 600 (G,H). Dense biofilms have formed on the surface of the SB 2 specimens. EGCG 200, 400, and 600, epigallocatechin-3-gallate at 200 µg/mL, 400 µg/mL, and 600 µg/mL, respectively; EGCG-3Me 200, 400, and 600, epigallocatechin-3-O-(3-O-methyl)-gallate at 200 µg/mL, 400 µg/mL, and 600 µg/mL, respectively; SB 2, Single Bond 2 (3M ESPE, St. Paul. MN, USA).


