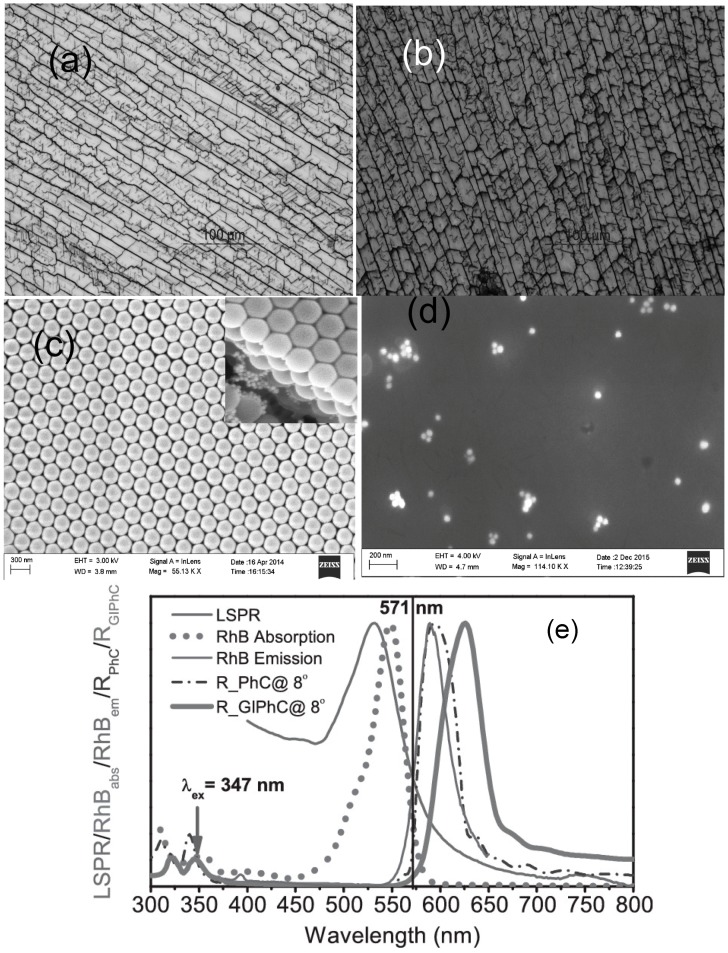
Figure 2.
Optical microscope images of: (a) PCs; and (b) GIPC, grown from polystyrene colloids with average diameter of 277 nm. The scale bar is 100 μm; (c) The FESEM image of PCs with the same colloidal diameter showing hexagonal periodic arrangement on the top surface. The scale bar is 300 nm. The inset shows the ordering in the different layers of the crystal, and the smaller particles inside the cracks are the gold nanoparticles infiltrated into the structure; (d) The FESEM image of AuNPs dispersed over a silicon substrate yields an average value of 40 nm for their diameter; (e) The normalized spectra of all features present in the sample, where the solid vertical line at 347 nm denotes the excitation wavelength and the vertical line at 571 nm marks the wavelength of maximum spectral overlap between the emission spectrum and the LSPR band of gold nanoparticles. Spectral bands (from left to right): first band is LSPR due to AuNPs, RhB in dot line is due to Rhodamine B absorption, then RhB line is due to RhB emission, R_PhC@8 in dot line is due to RhB in polystyrene PCs, and finally R_GIPhC@8 in thick solid gray line is due to RhB in polystyrene PCs infiltrated with AuNPs (adapted from [60]).

