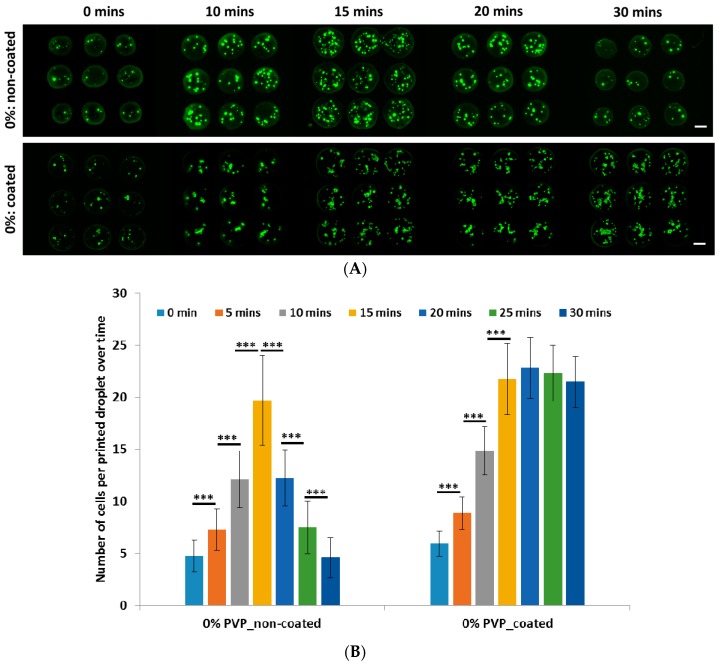
Figure 4.
(A) Representative images of printed cells in non-coated and coated printing cartridges (constant cellular concentration of 1.0 mil cells/mL) at different time intervals (scale bar: 200 µm); (B) A graph showing the number of cells per printed droplet over time (mean ± SD). Significance levels are as follows: p < 0.005 (***), p < 0.05 (*).

