
Figure 2.
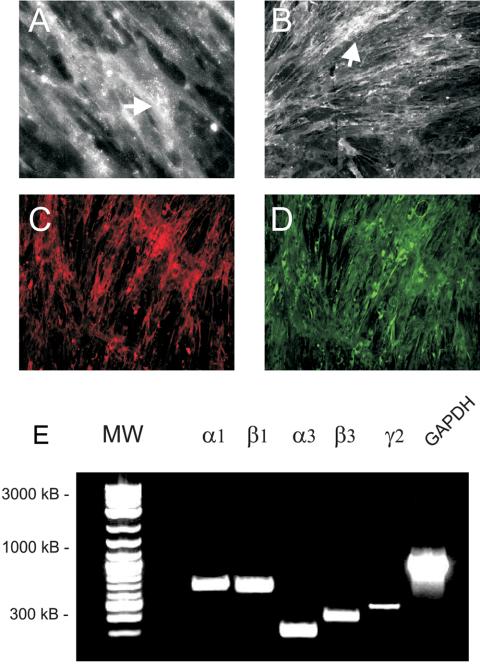
hMSC express Ln-5 in culture. (A–D) Cells were grown on glass coverslips for 8 d and then were fixed and stained for α3 integrin (A and C) and human Ln-5 (B and D). (A) Magnification, 40×. (B–D) Magnification, 10×. Images in C and D were taken of the same microscopic field. (E) RT-PCR was used to amplify the indicated mRNA transcripts from hMSC grown on tissue culture plastic. The α1 and β1 chains, found in Ln-1, were included as a positive control. GAPDH was amplified as a positive control.