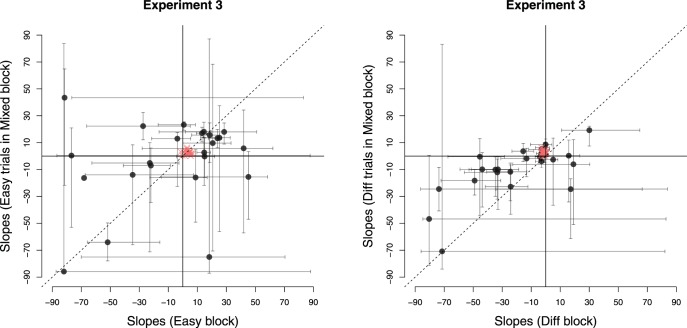
Figure 10.
Slopes of estimated lines of indifference in Experiment 3. The panel on the left compares slopes for the easy trials during mixed games with slopes for all trials during easy games, whereas the panel on the right compares slopes for the difficult trials in mixed games with slopes for all trials during difficult games. In each panel, the solid vertical and horizontal lines show lines of zero slope (flat threshold), and the dashed line shows the curve for equal slopes in the two types of games. Each circle shows the estimated slopes for one participant and crosses show estimated slopes from simulated optimal participants. See the online article for the color version of this figure.

