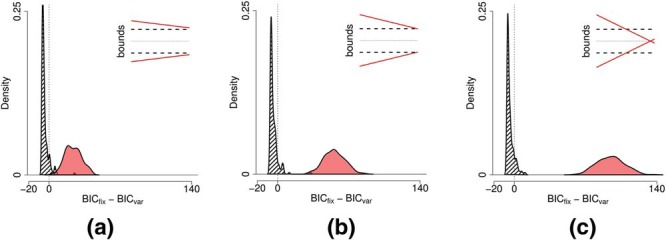
Figure D2.

Each plot shows the distribution of difference in Bayesian information criterion (BIC) values for fixed boundary model (only evidence used as predictor) and variable boundary model (both evidence and time used as predictors). Hatched distributions show this difference in BIC values when decisions are simulated using integration of evidence to a fixed boundary (inset, dashed line) and shaded distributions show the difference in BIC values when decisions are simulated from integration to a decreasing boundary (inset, solid line). Three different slopes are used for decreasing boundaries (a) 15 degrees, (b) 30 degrees, and (c) 60 degrees. See the online article for the color version of this figure.
