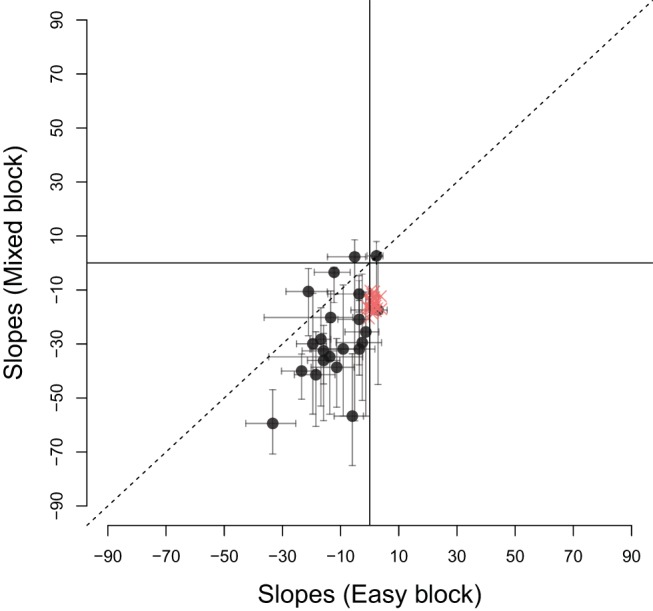
Figure 5.

Each circle (black) compares the estimated slope in easy and mixed games for 1 participant. Circles below the dashed line were participants who had a larger gradient of the inferred boundary during the mixed games as compared to the easy games. Error bars indicate the 0.95 percentile bootstrapped confidence intervals for the estimated slopes. Crosses (red) show 24 simulated participants—decisions were simulated using a rise-to-threshold model with optimal boundaries shown in Figures 2d and 2f. See the online article for the color version of this figure.
