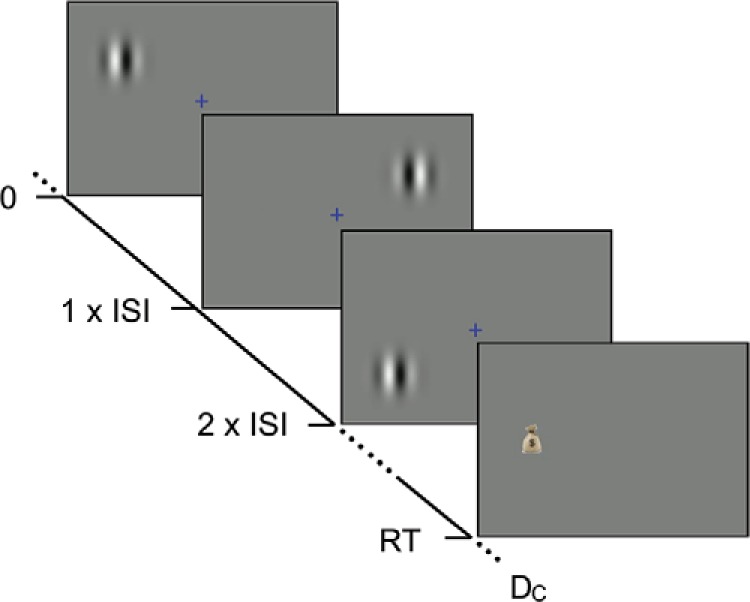
Figure 7.

An illustration of the paradigm for Experiments 2a through 2d. During each trial, participants chose left or right based on a sequence of cues. Each cue was a Gabor pattern displayed (for a fifth of interstimulus interval [ISI]) in one of four possible locations, equidistant from the fixation cross. If the decision was correct (as in this example), a money bag was displayed on the chosen side of the fixation cross and the participant waited for the duration DC before starting the next trial. If the decision was incorrect, no money bag was displayed and the participant waited for the duration DI before starting the next trial. RT = Reaction time. See the online article for the color version of this figure.
