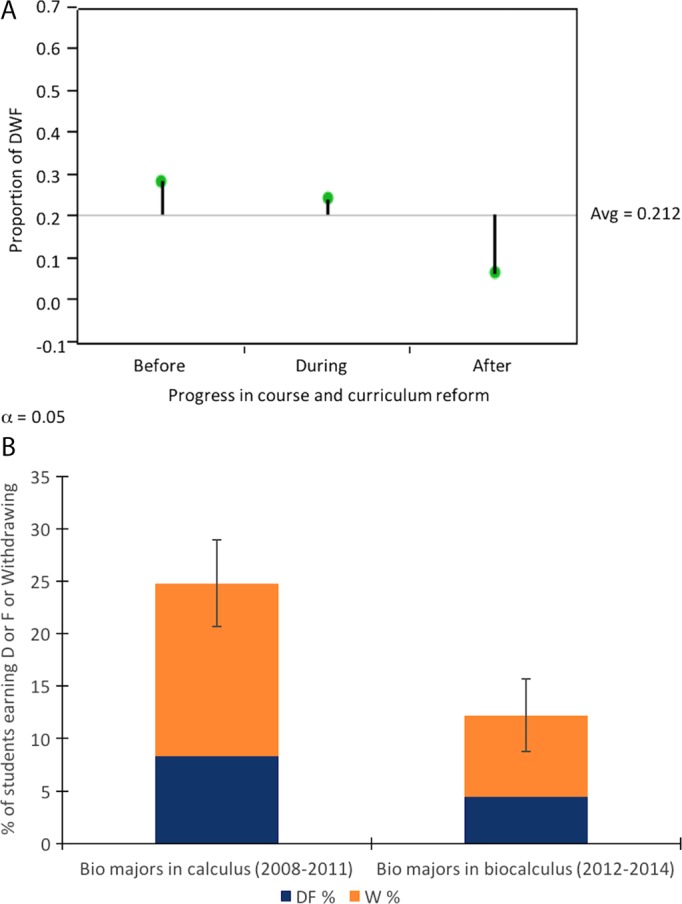
FIGURE 1.

(A) DWF proportions from Fall 2010 to Spring 2014 for biocalculus at Unity before, during, and after the curricular and program changes as represented by a trend analysis using JMP statistical software. (B) DWF (in blue) and “W” (in orange) percentages at UP for biology students in traditional calculus from 2008 to 2011 compared with biology students in biocalculus from 2012 to 2014.
