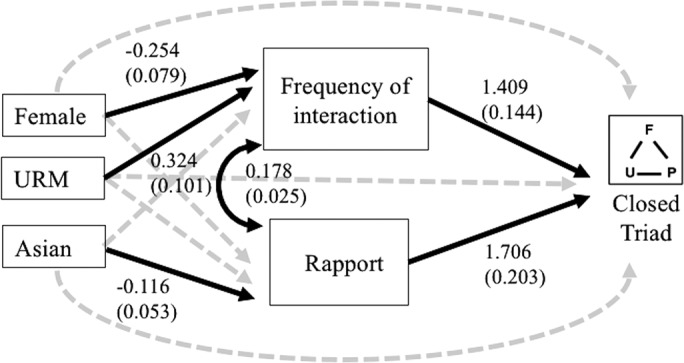
FIGURE 3.

Path model 1 showing all pathways tested (solid black and dotted gray lines). The regression coefficient (±SE) for each significant pathway (solid black lines) is shown. Female → frequency of interaction p = 0.001; URM → frequency of interaction p = 0.001; Asian → rapport p = 0.028; frequency of interaction ↔ rapport p = 0.000; frequency of interaction → closed triad p = 0.000; rapport → closed triad p = 0.000.
